

Question: Ready , x ? Accessibility: Investigate Using Excel functions ( not Pivot Table! ) create a table that shows the count, average cd _ gross,
Ready Accessibility: Investigate
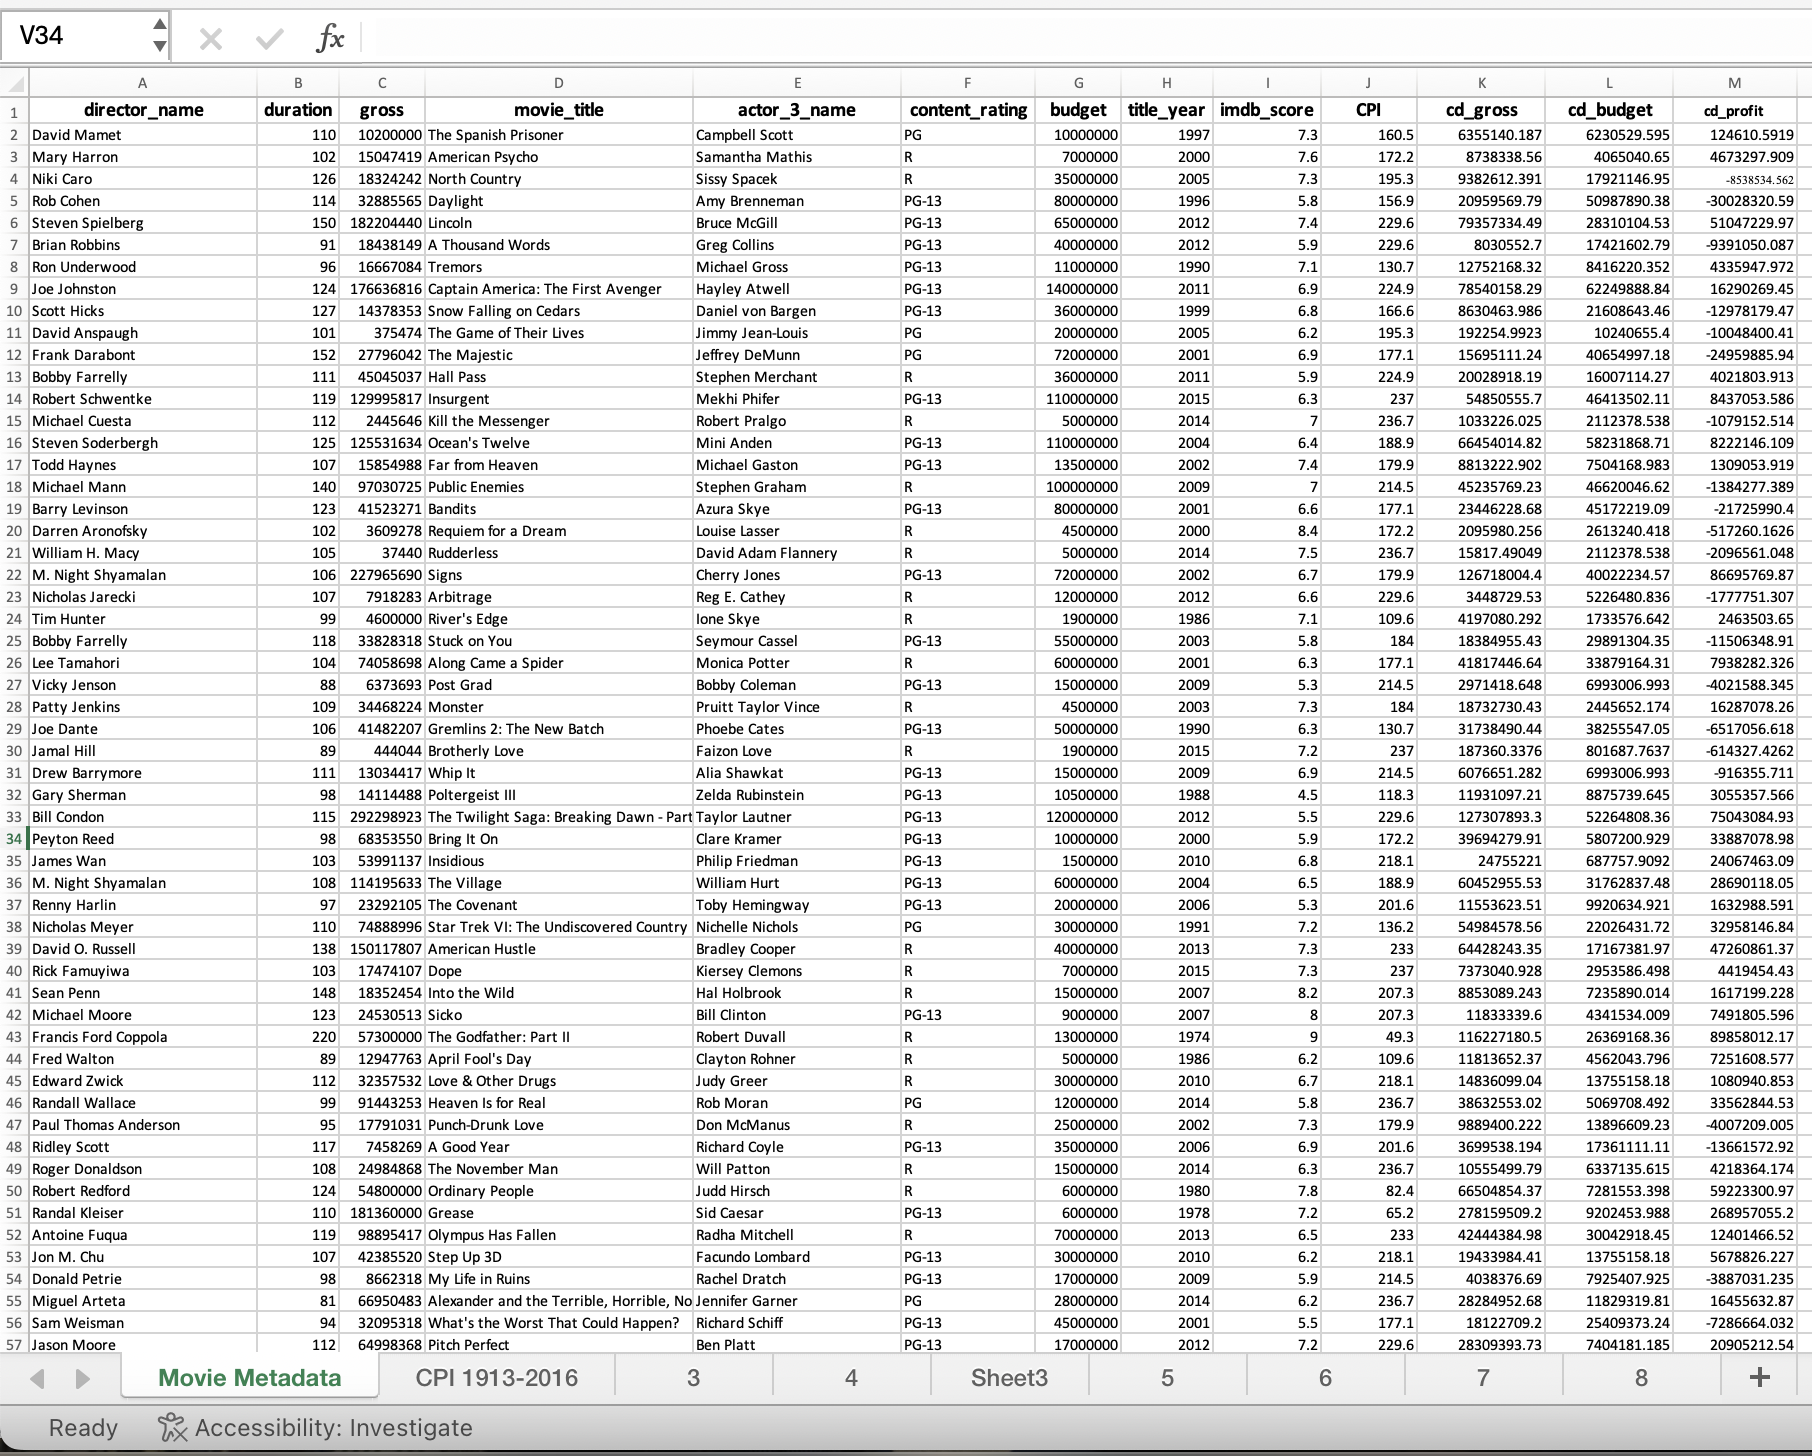
Using Excel functions not Pivot Table! create a table that shows the count, average cdgross, and average imdbscore for movies with titleyear by contentrating include one row for each unique contentrating. Include only content ratings that have nonzero counts for the Year time period
Using either Excel functions or a pivot table, make a table and graph of the top movies cdgross for each year in the dataset, arranged in chronological order. Include in your table the year and the top cdgross. For an additional challenge you can try to include the movie titles as well, but they are not required.
Create a Pivot Table that shows directorname, total cdgross, average cdgross, count of movies, and average imdbscore for the top directors by average cdgross, sorted by average cdgross from largest to smallest.
Using either Excel functions or a pivot table, make a table that shows the counts and percentages of profitable and unprofitable movies in each contentrating category. Include only the following contentratings: G PG PG NC R X For example, in the row for the G rating I should be able to see how many movies were profitable and how many movies were unprofitable, and also see those counts expressed as percentages of Grated movies.
Reproduce the table from task # with a Pivot Table, but use a slicer for contentrating. Make sure to base the pivot table on the original data, not your table from #
show any formulas used please and only use excel functions no calculations.
Step by Step Solution
There are 3 Steps involved in it
1 Expert Approved Answer
Step: 1 Unlock

Question Has Been Solved by an Expert!
Get step-by-step solutions from verified subject matter experts
Step: 2 Unlock
Step: 3 Unlock