

Question: Refer t o the table Factors for Computing Control Chart Limits ( 3 sigma ) for this problem. A process a t Amit Eynan Bottling
Refer the table Factors for Computing Control Chart Limits sigma for this problem.
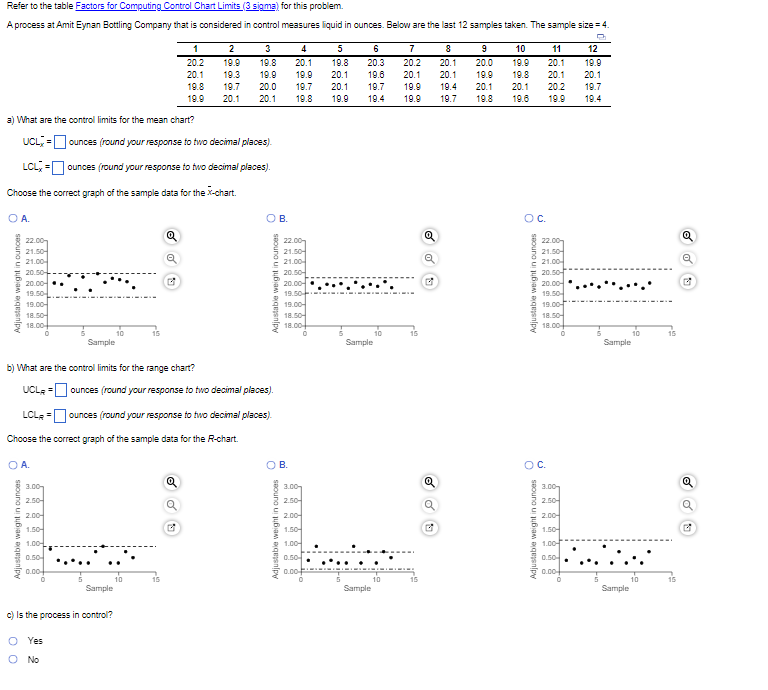
A process Amit Eynan Bottling Company that considered control measures liquid ounces. Below are the last samples taken. The sample size
ounces your response two decimal places
ounces your response two decimal places
Choose the correct graph the sample data for the chart.
ounces your response two decimal places
ounces your response two decimal places
Choose the correct graph the sample data for the chart.
Data Table
Step by Step Solution
There are 3 Steps involved in it
1 Expert Approved Answer
Step: 1 Unlock

Question Has Been Solved by an Expert!
Get step-by-step solutions from verified subject matter experts
Step: 2 Unlock
Step: 3 Unlock