

Question: Refer the table below on the average excess return of the U . S . equity market and the standard deviation of that excess return.
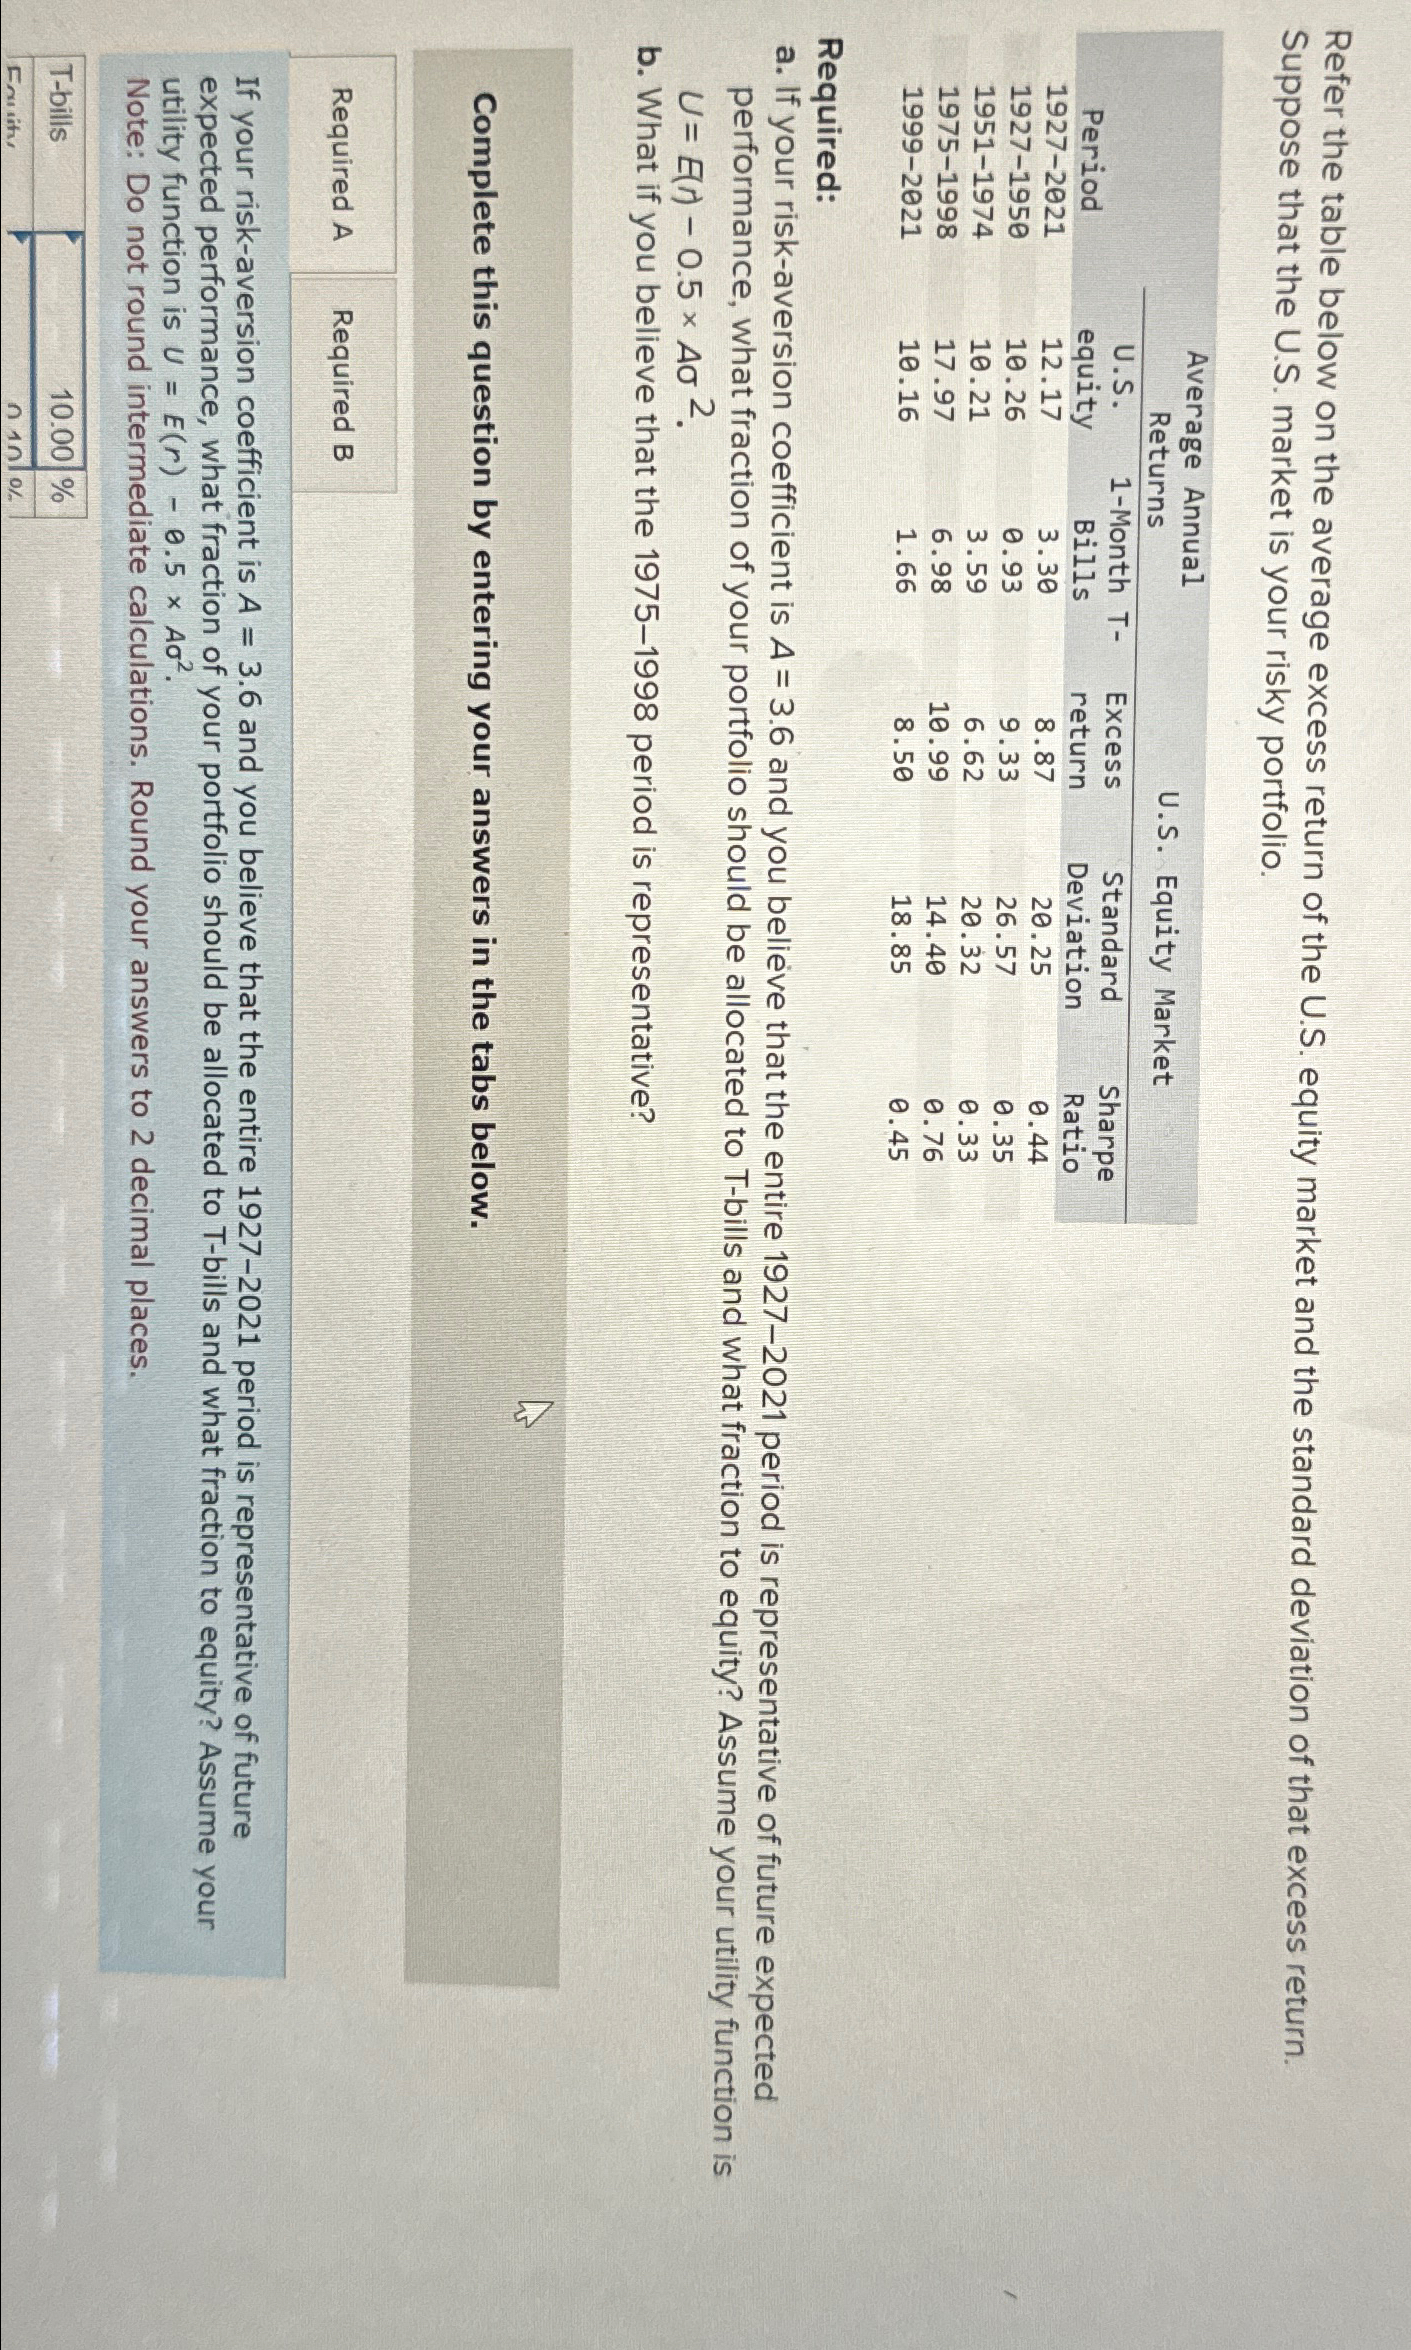
Refer the table below on the average excess return of the US equity market and the standard deviation of that excess return. Suppose that the US market is your risky portfolio.
tabletableAverage AnnualReturnsUS Equity MarketPeriodUSMonth TExcess,Standard,SharpeequityBills,return,Deviation,Ratio,
Required:
a If your riskaversion coefficient is and you believe that the entire period is representative of future expected performance, what fraction of your portfolio should be allocated to Tbills and what fraction to equity? Assume your utility function is
b What if you believe that the period is representative?
Complete this question by entering your answers in the tabs below.
Required
Required B
If your riskaversion coefficient is and you believe that the entire period is representative of future expected performance, what fraction of your portfolio should be allocated to Tbills and what fraction to equity? Assume your utility function is
Note: Do not round intermediate calculations. Round your answers to decimal places.
tableTbills,
Step by Step Solution
There are 3 Steps involved in it
1 Expert Approved Answer
Step: 1 Unlock

Question Has Been Solved by an Expert!
Get step-by-step solutions from verified subject matter experts
Step: 2 Unlock
Step: 3 Unlock