

Question: Refer to Table S 6 1 - Factors for Computing Control Chart Limits ( 3 sigma ) for this problem. executives take samples of eight
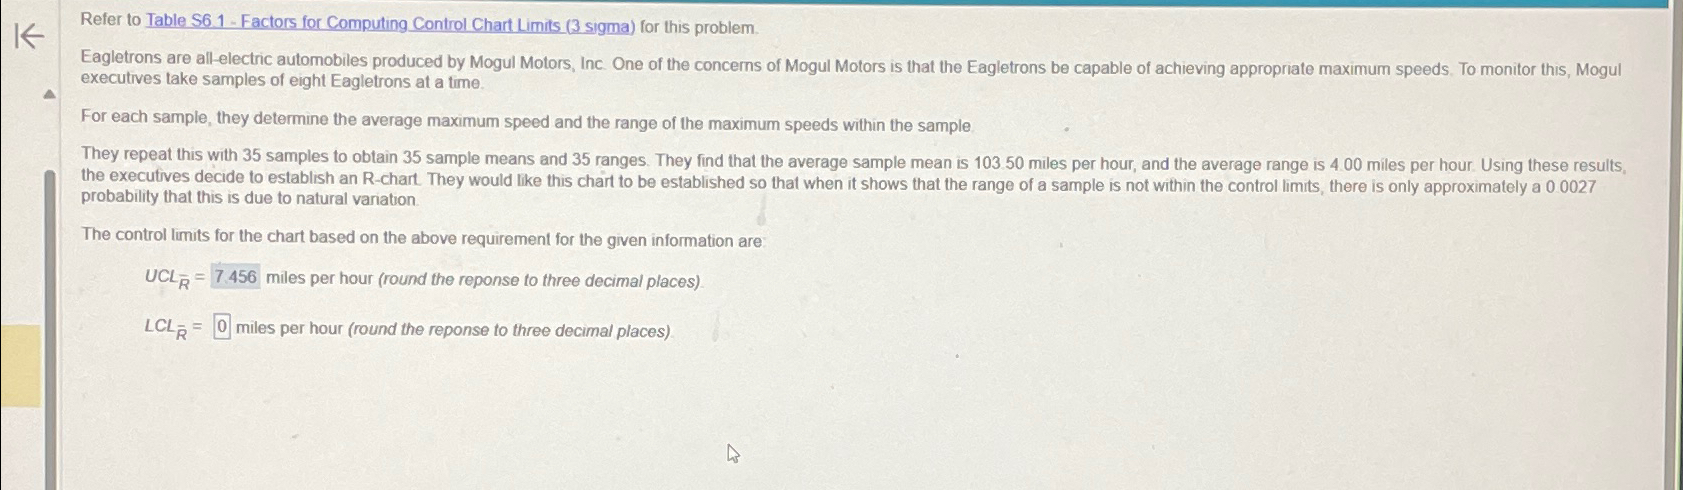
Refer to Table S Factors for Computing Control Chart Limits sigma for this problem. executives take samples of eight Eagletrons at a time.
For each sample, they determine the average maximum speed and the range of the maximum speeds within the sample probability that this is due to natural variation.
The control limits for the chart based on the above requirement for the given information are:
miles per hour the reponse three decimal places
miles per hour the reponse three decimal places
Step by Step Solution
There are 3 Steps involved in it
1 Expert Approved Answer
Step: 1 Unlock

Question Has Been Solved by an Expert!
Get step-by-step solutions from verified subject matter experts
Step: 2 Unlock
Step: 3 Unlock