

Question: Refer to Table S6.1 - Factors for Computing Control Chart Limits ( 3 sigma) for this problem. computed. The results were: begin{tabular}{ccc|ccc} hline Sample &
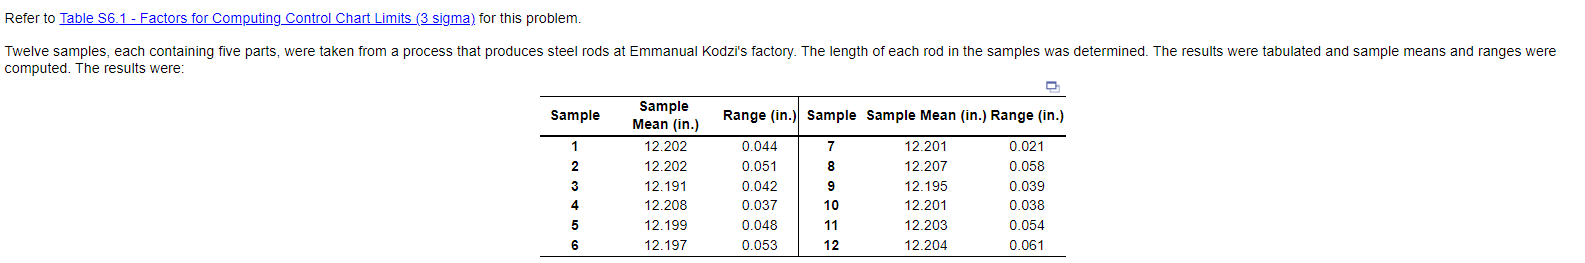
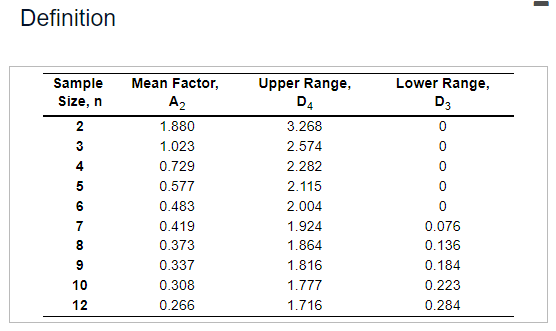
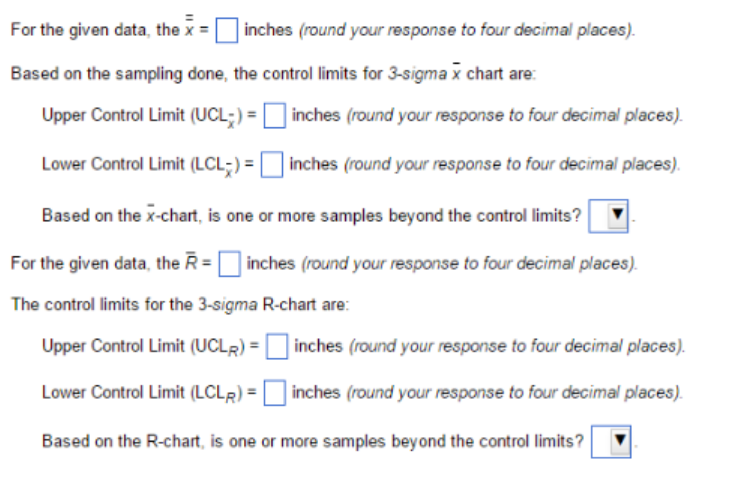
Refer to Table S6.1 - Factors for Computing Control Chart Limits ( 3 sigma) for this problem. computed. The results were: \begin{tabular}{ccc|ccc} \hline Sample & SampleMean(in.) & Range (in.) & Sample & Sample Mean (in.) Range (in.) \\ \hline 1 & 12.202 & 0.044 & 7 & 12.201 & 0.021 \\ 2 & 12.202 & 0.051 & 8 & 12.207 & 0.058 \\ 3 & 12.191 & 0.042 & 9 & 12.195 & 0.039 \\ 4 & 12.208 & 0.037 & 10 & 12.201 & 0.038 \\ 5 & 12.199 & 0.048 & 11 & 12.203 & 0.054 \\ 6 & 12.197 & 0.053 & 12 & 12.204 & 0.061 \\ \hline \end{tabular} Definition For the given data, the x= inches (round your response to four decimal places). Based on the sampling done, the control limits for 3-sigma x chart are: Upper Control Limit (UCLx)= inches (round your response to four decimal places). Lower Control Limit (LCL)= inches (round your response to four decimal places). Based on the x-chart, is one or more samples beyond the control limits? For the given data, the R= inches (round your response to four decimal places). The control limits for the 3-sigma R-chart are: Upper Control Limit (UCLR)= inches (round your response to four decimal places). Lower Control Limit (LCLR)= inches (round your response to four decimal places). Based on the R-chart, is one or more samples beyond the control limits
Step by Step Solution
There are 3 Steps involved in it

Get step-by-step solutions from verified subject matter experts