

Question: Refer to the table Eactors for Computog. Control ChartLimits (3. sigma) for this problem. Your supervisor, Lisa Lehmann, has asked that you report on the
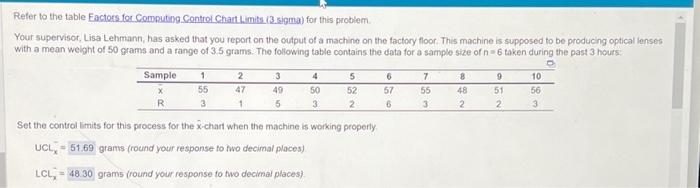
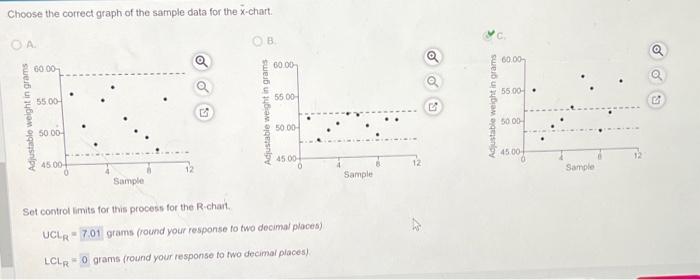
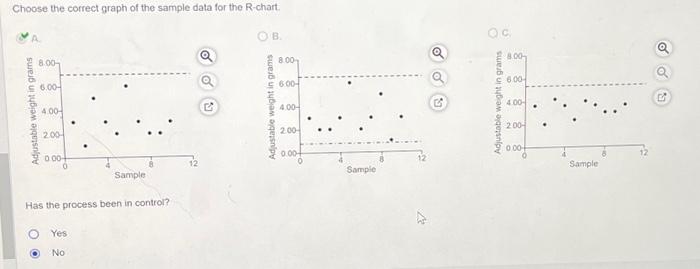
Refer to the table Eactors for Computog. Control ChartLimits (3. sigma) for this problem. Your supervisor, Lisa Lehmann, has asked that you report on the output of a machino on the factory floor. This machine is supposed to be producing optical lenses with a mean weight of 50 grams and a range of 3.5 grams. The foliowing table contains the data for a sample size of n=6 taken during the past 3 hours: Set the control limits for this process for the x-chart when the machine is working properly UCLx=grams(roundyourresponsetotwodecimalplaces)LCLx=48.30grams(roundyourresponsetotwodecimalplaces) Choose the correct graph of the sample data for the x-chart. in a Set control limits for this process for the R-chat. uCt R=7.01 grams (round your response to two decimal ploces) LCLR=0 grams (round your response to two decimal places). Choose the correct graph of the sample data for the R-chart. Has the process been in control? Yes No
Step by Step Solution
There are 3 Steps involved in it

Get step-by-step solutions from verified subject matter experts