

Question: Refer to the table Factors for Computing _ Control Chart Limits ( 3 ? sigma ) for this problem. Your supervisor, Lisa Lehmann, has asked
Refer to the table Factors for ComputingControl Chart Limits sigma for this problem.
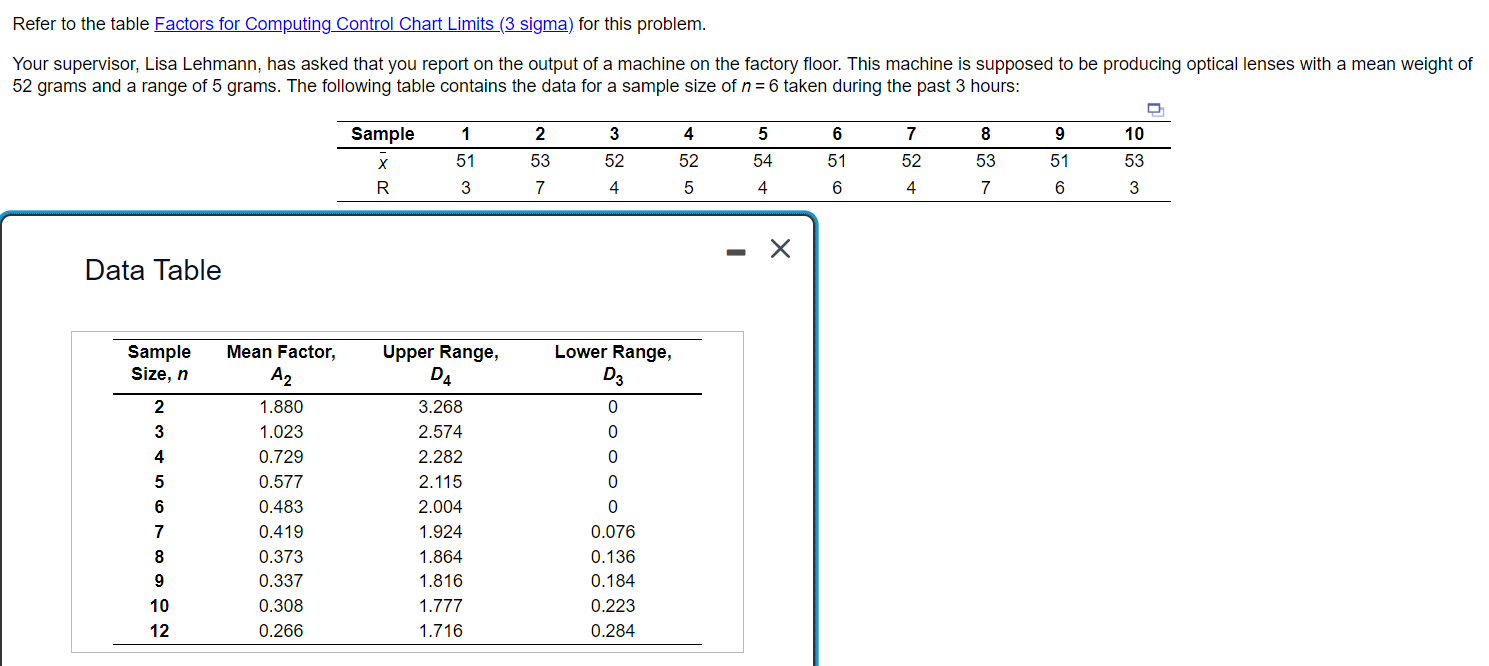
Your supervisor, Lisa Lehmann, has asked that you report on the output of a machine on the factory floor. This machine is supposed to be producing optical lenses with a mean weight of
grams and a range of grams. The following table contains the data for a sample size of taken during the past hours:
a What are the chart control limits when the machine is working properly? Calculate UCL X and LCL X b What are the Rchart control limits when the machine is working properly? Calculate Upper Range D and Lower Range D c Calculate UCL R and LCL R for the R chart d Has the process been in control? Yes or no
Step by Step Solution
There are 3 Steps involved in it
1 Expert Approved Answer
Step: 1 Unlock

Question Has Been Solved by an Expert!
Get step-by-step solutions from verified subject matter experts
Step: 2 Unlock
Step: 3 Unlock