

Question: Refer to the two cases (slide 2 vs slide 3). We demonstrated that at the same 20% growth into the next year for both cases
Refer to the two cases (slide 2 vs slide 3). We demonstrated that at the same 20% growth into the next year for both cases (and the same assumption that Debt-Equity Ratios stay constant year to year), slide 2 does not need EFN (rather, slide 2 could afford to pay out some dividend in the next year), but slide 3 does need EFN.
To explain the cause of the difference, apply the relationships among the 3 rates: expected growth rate 20%, sustainable growth rate, and ROE (recall that ROE can be calculated with beginning or ending equity balance).
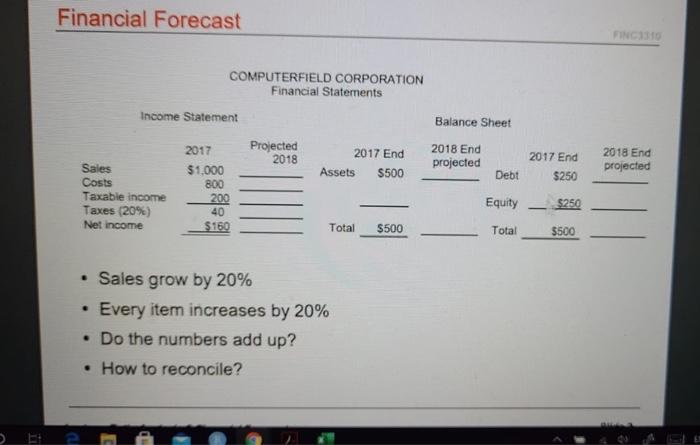
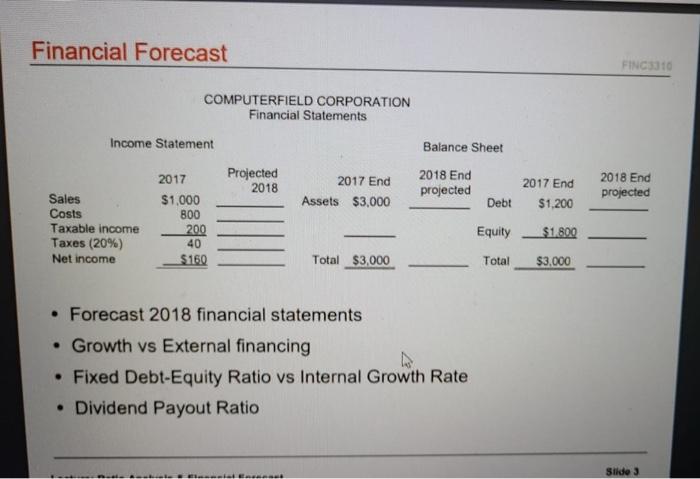
Financial Forecast 1516 COMPUTERFIELD CORPORATION Financial Statements Income Statement Projected 2018 2017 End Assets $500 Balance Sheet 2018 End projected Debt 2017 End $250 2018 End projected Sales Costs Taxable income Taxes (20%) Net income 2017 $1,000 800 200 40 $160 Equity $250 Total $500 Total $50 Sales grow by 20% Every item increases by 20% Do the numbers add up? How to reconcile? 2 Financial Forecast FINC3310 COMPUTERFIELD CORPORATION Financial Statements Income Statement Balance Sheet Projected 2018 2017 End Assets $3,000 2018 End projected 2017 End $1.200 2018 End projected Debt Sales Costs Taxable income Taxes (20%) Net income 2017 $1,000 800 200 40 $160 Equity $1.800 Total $3,000 Total $3,000 Forecast 2018 financial statements Growth vs External financing . Fixed Debt-Equity Ratio vs Internal Growth Rate Dividend Payout Ratio Side 3 Financial Forecast 1516 COMPUTERFIELD CORPORATION Financial Statements Income Statement Projected 2018 2017 End Assets $500 Balance Sheet 2018 End projected Debt 2017 End $250 2018 End projected Sales Costs Taxable income Taxes (20%) Net income 2017 $1,000 800 200 40 $160 Equity $250 Total $500 Total $50 Sales grow by 20% Every item increases by 20% Do the numbers add up? How to reconcile? 2 Financial Forecast FINC3310 COMPUTERFIELD CORPORATION Financial Statements Income Statement Balance Sheet Projected 2018 2017 End Assets $3,000 2018 End projected 2017 End $1.200 2018 End projected Debt Sales Costs Taxable income Taxes (20%) Net income 2017 $1,000 800 200 40 $160 Equity $1.800 Total $3,000 Total $3,000 Forecast 2018 financial statements Growth vs External financing . Fixed Debt-Equity Ratio vs Internal Growth Rate Dividend Payout Ratio Side 3
Step by Step Solution
There are 3 Steps involved in it

Get step-by-step solutions from verified subject matter experts