

Question: Referring to the images below, explain how you would create a pivot table that 3 shows the total cost of sales for each Channel: Choose
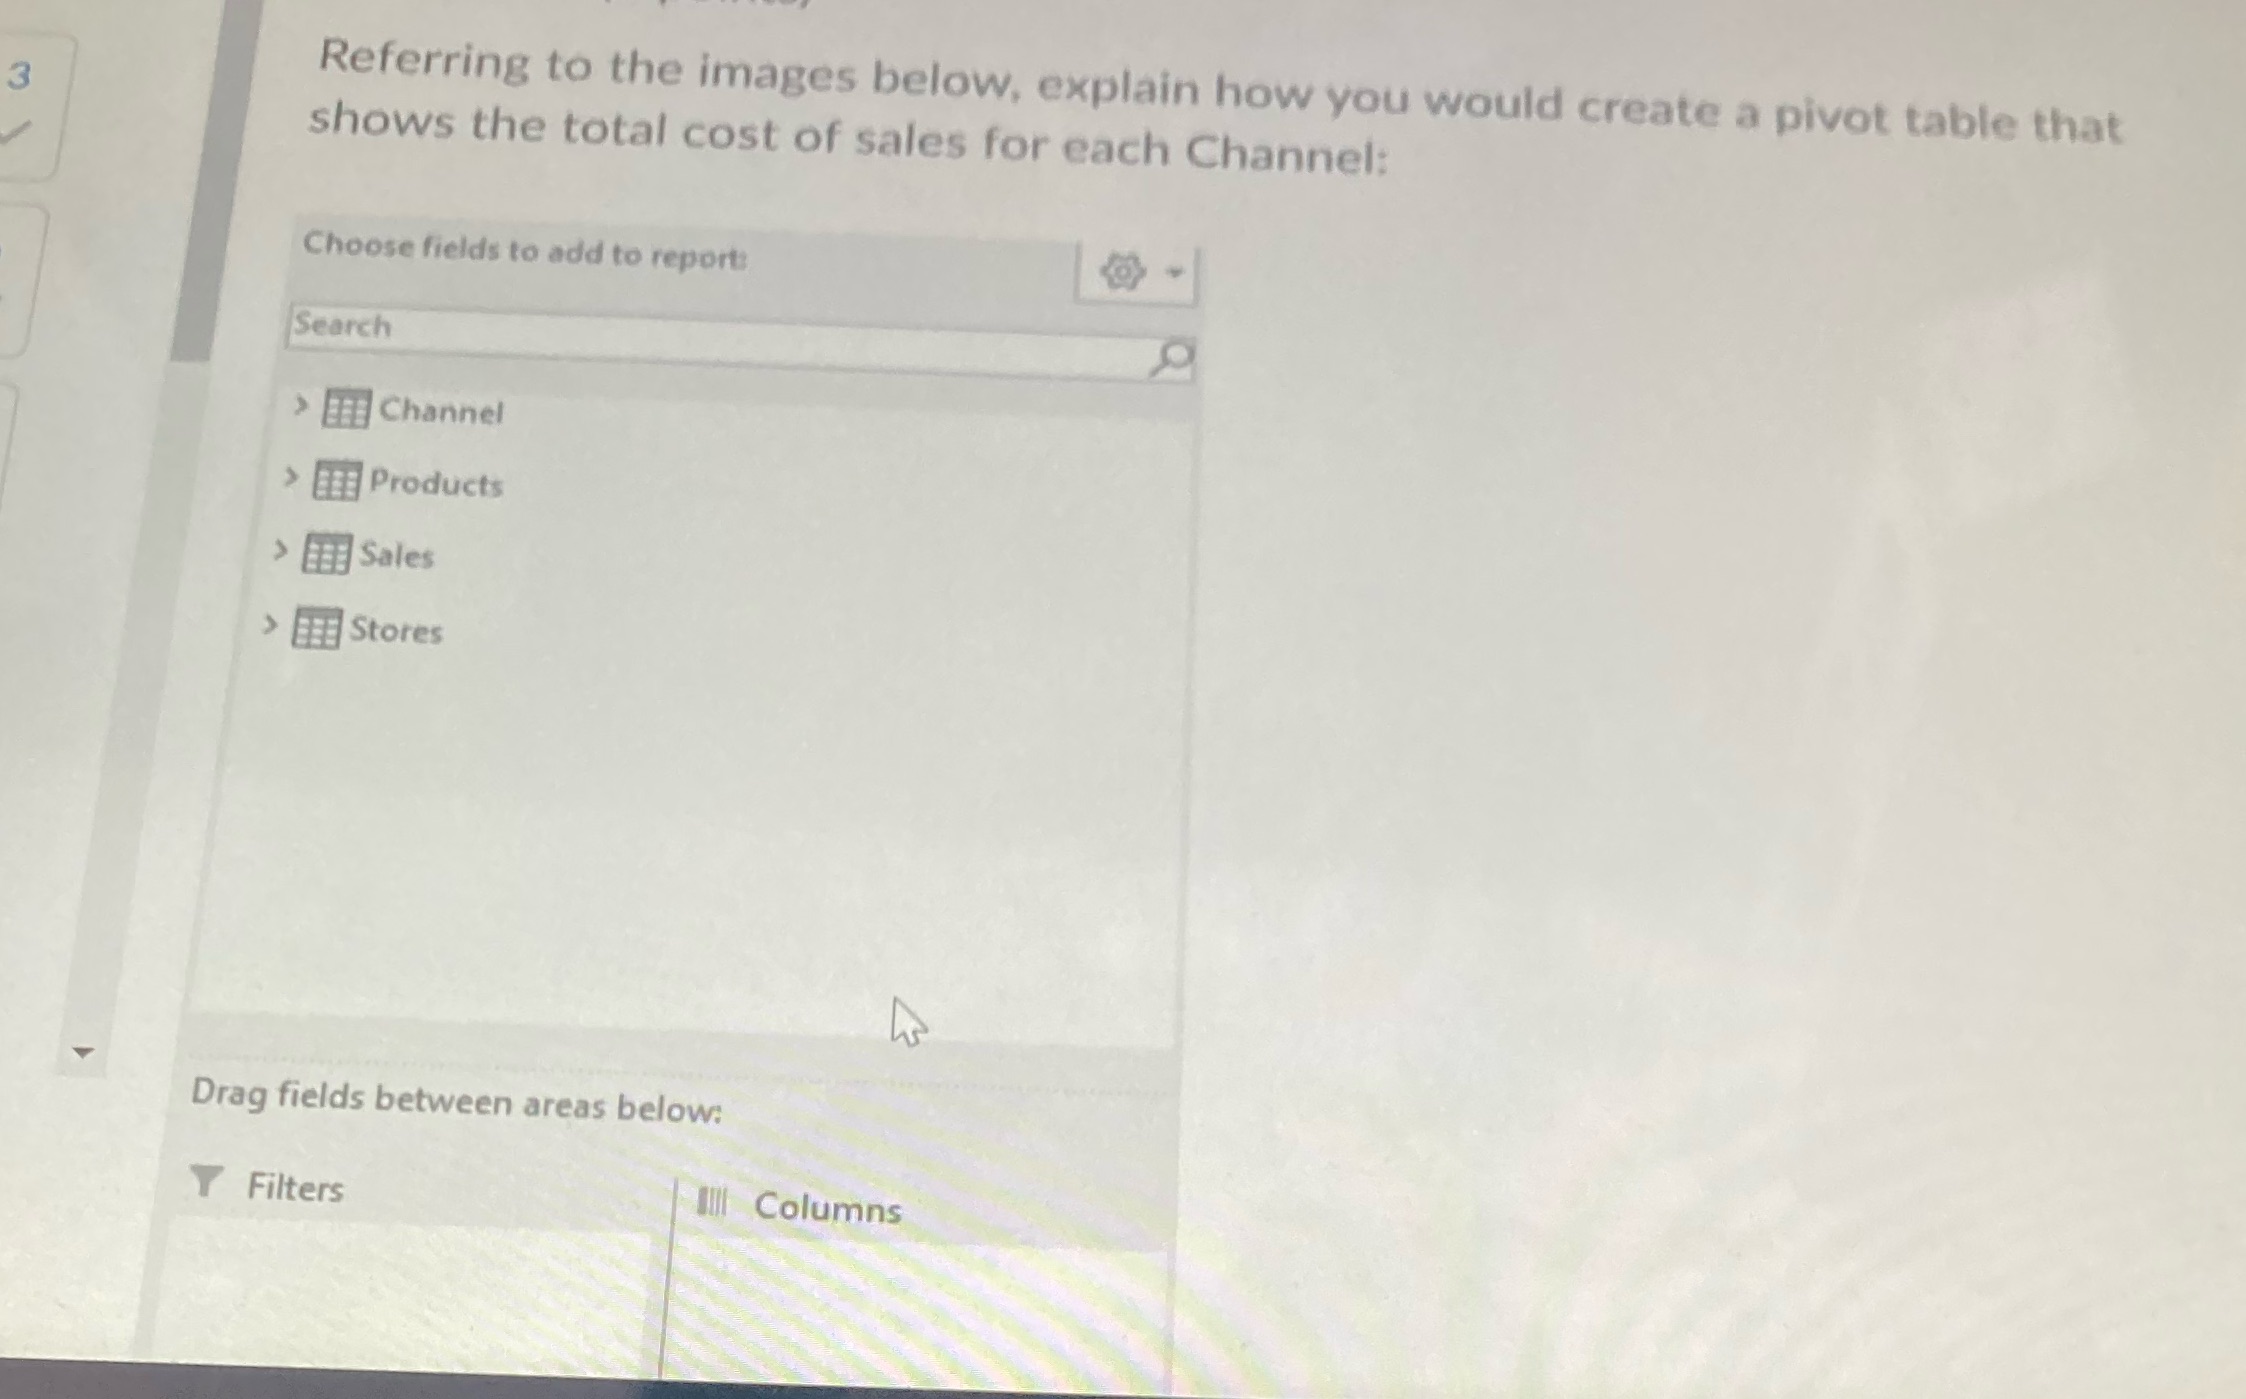
Referring to the images below, explain how you would create a pivot table that 3 shows the total cost of sales for each Channel: Choose fields to add to report: Search >Channel > Products >Sales >Stores Drag fields between areas below: Y Filters Ill Columns
Step by Step Solution
There are 3 Steps involved in it
1 Expert Approved Answer
Step: 1 Unlock

Question Has Been Solved by an Expert!
Get step-by-step solutions from verified subject matter experts
Step: 2 Unlock
Step: 3 Unlock