

Question: Regarding the control chart for % contaminated bottles, is the process in control? Give reasons for your answer. Batch Litres and % Contaminated y=0.0364x+6.3236R2=0.0007 Histogram
Regarding the control chart for % contaminated bottles, is the process in control? Give reasons for your answer.
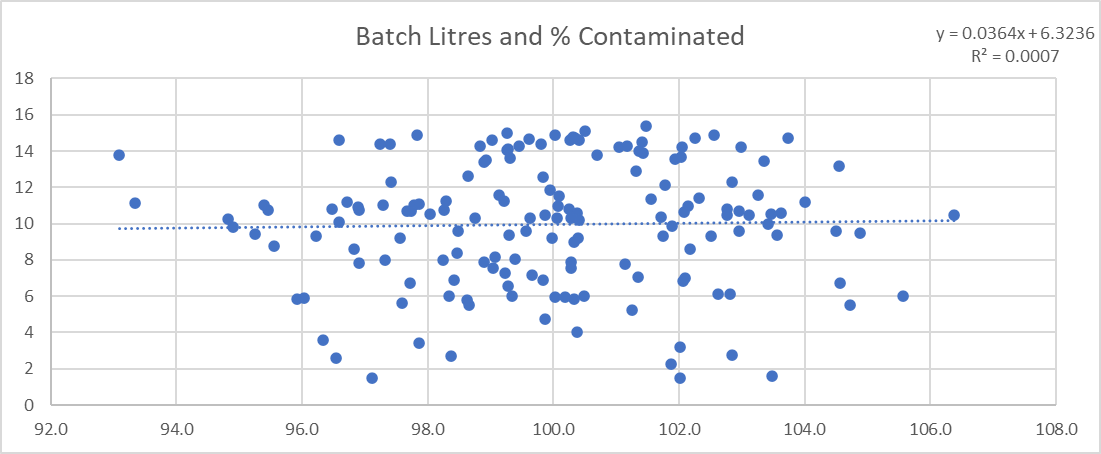
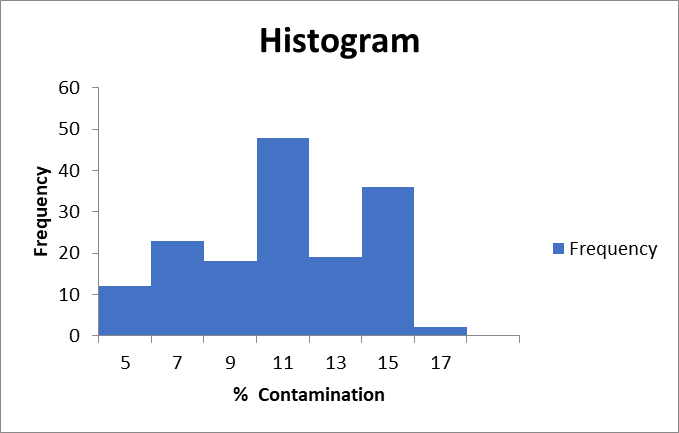
Batch Litres and \% Contaminated y=0.0364x+6.3236R2=0.0007 Histogram Frequency
Step by Step Solution
There are 3 Steps involved in it
1 Expert Approved Answer
Step: 1 Unlock

Question Has Been Solved by an Expert!
Get step-by-step solutions from verified subject matter experts
Step: 2 Unlock
Step: 3 Unlock