

Question: Required: 1. Using the data from 2022 in Gaming Table Cost Data, create an Excel spreadsheet to provide a sensitivity analysis of the effect
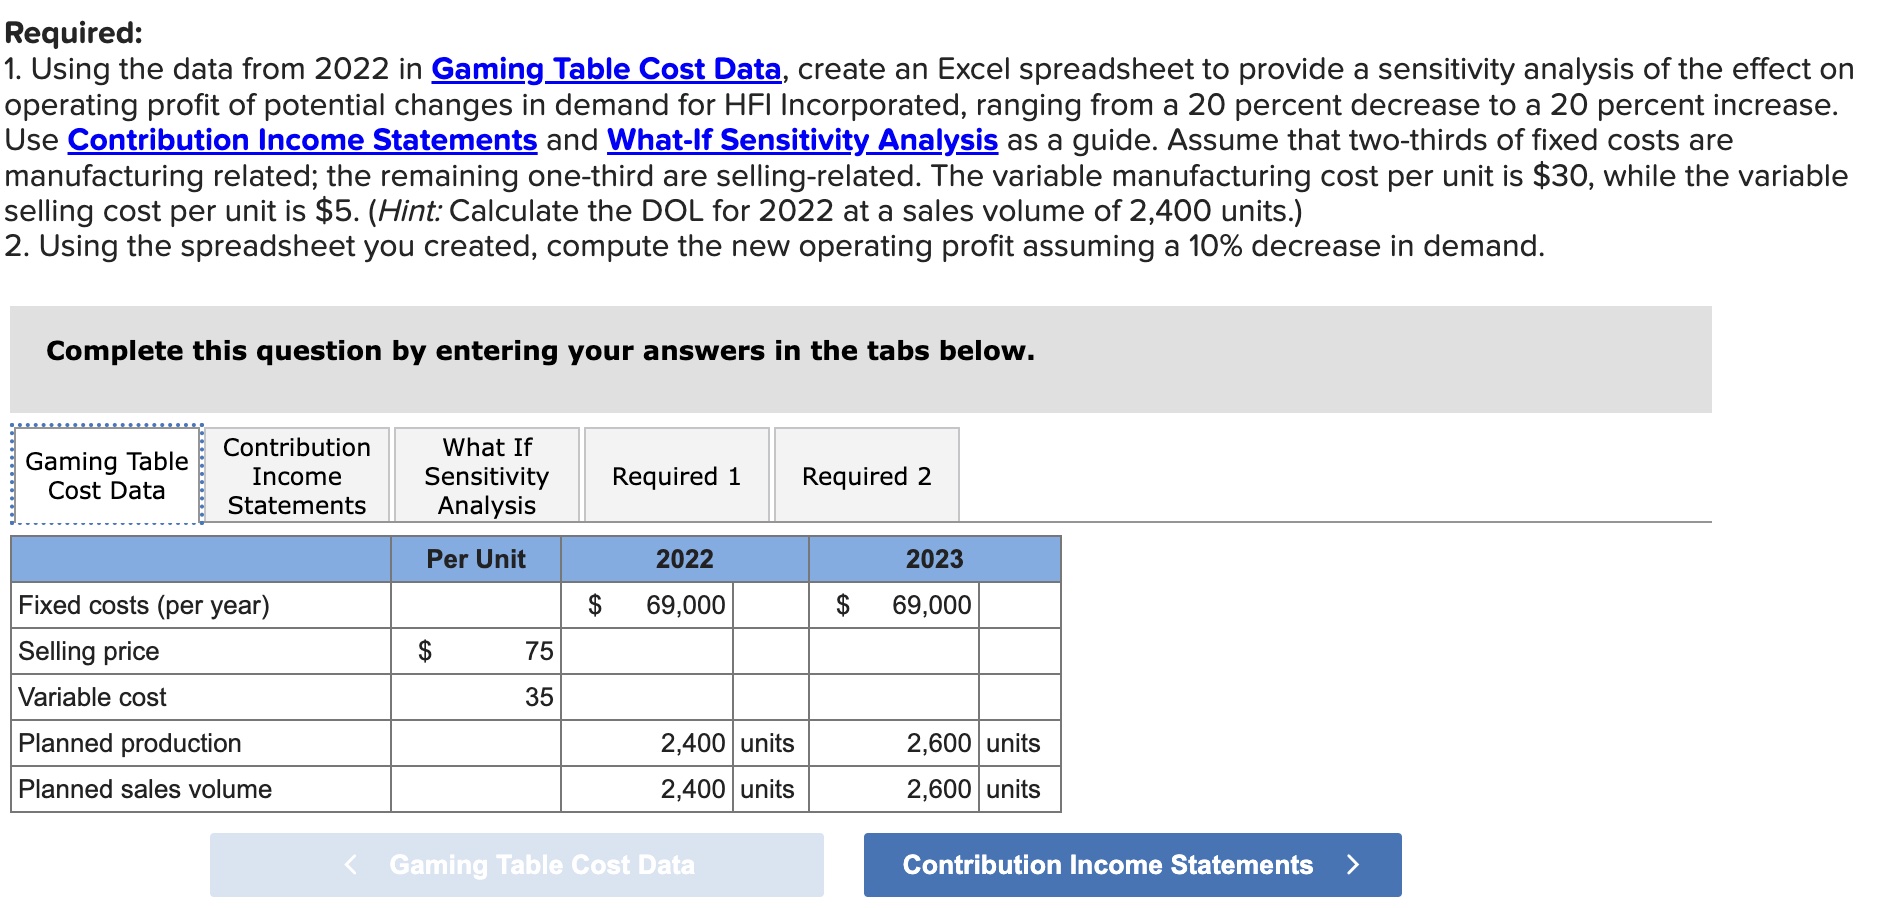
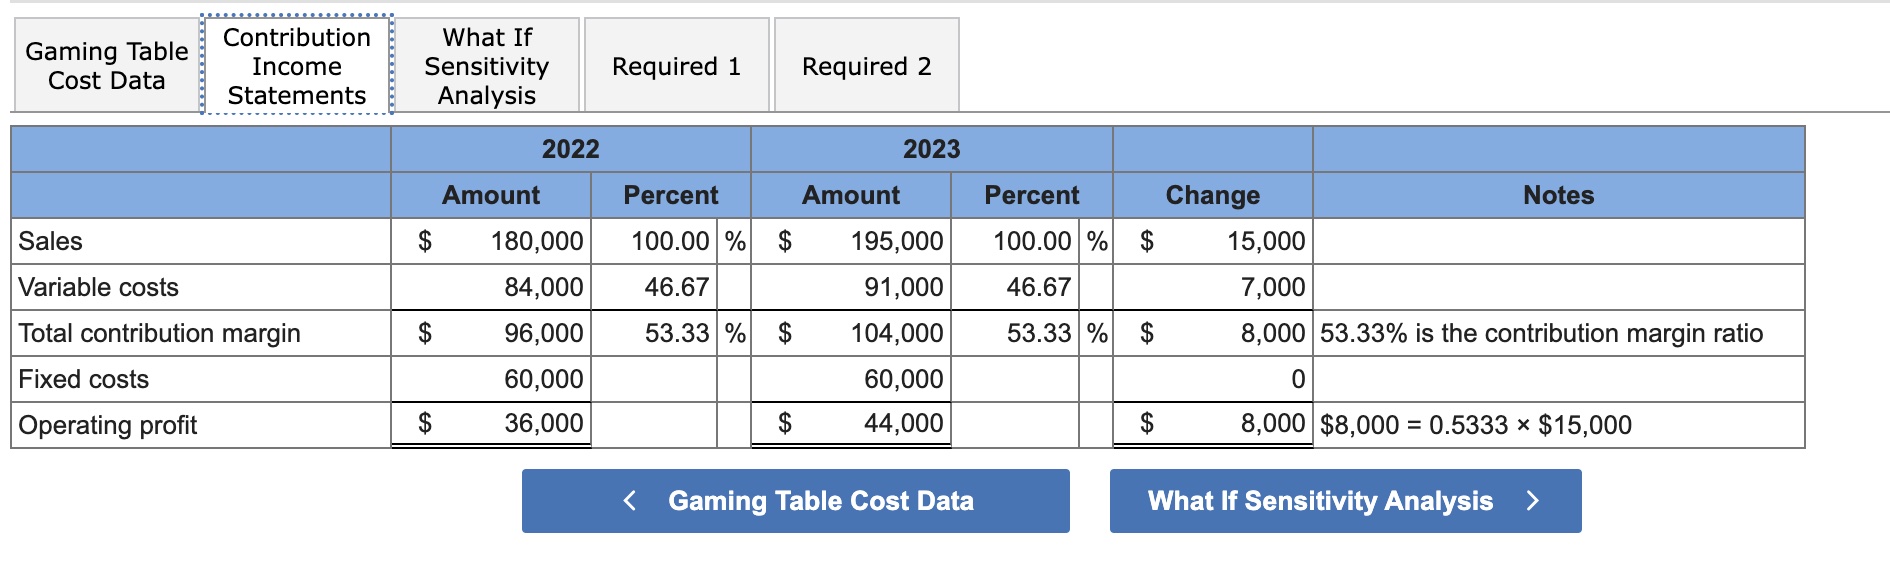
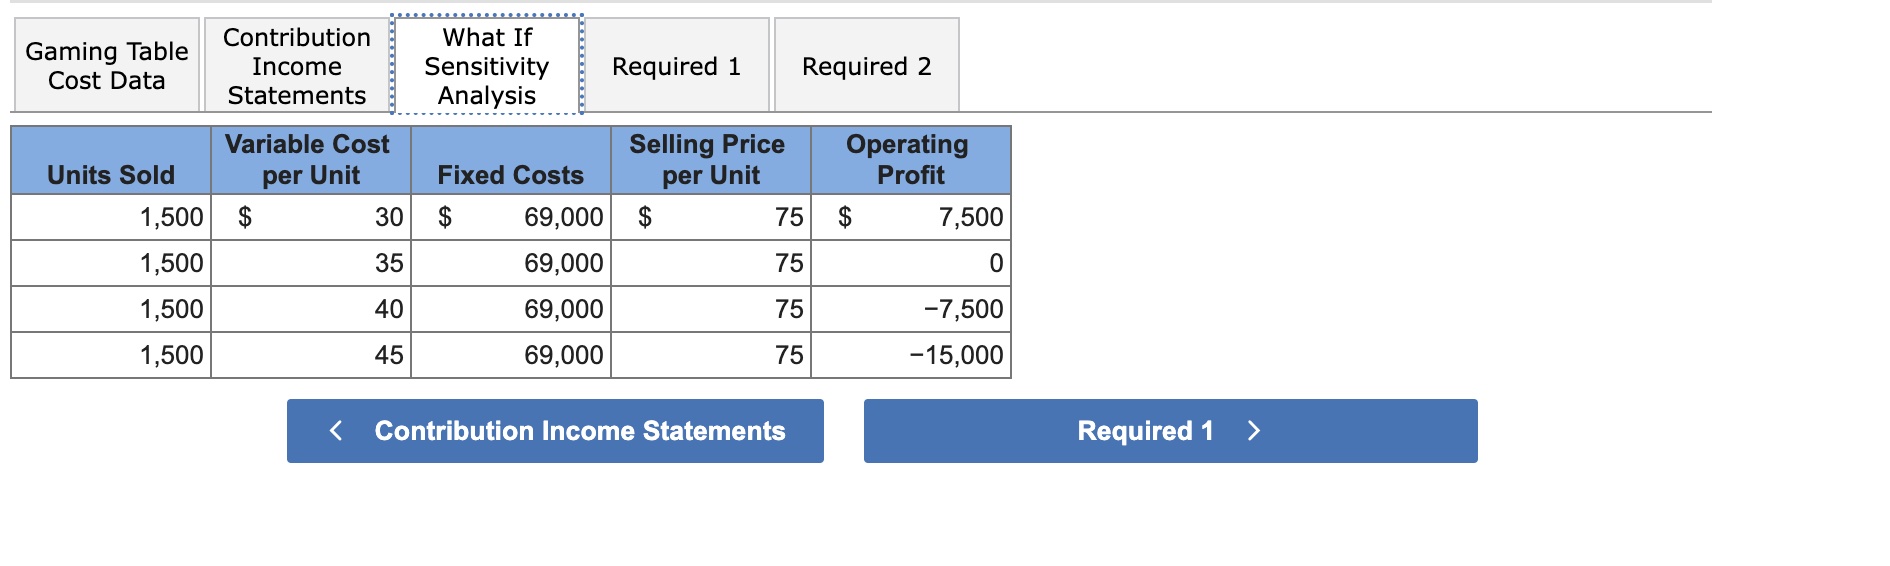
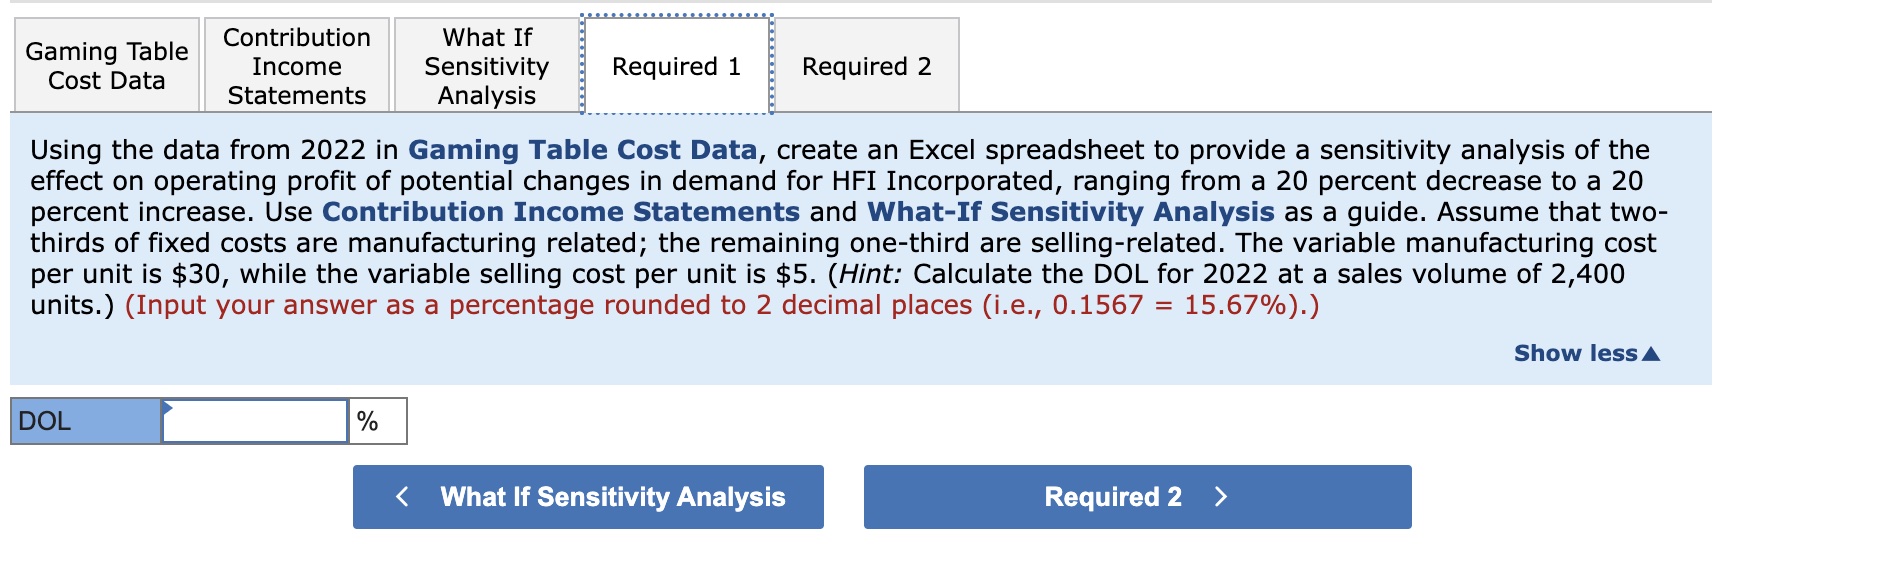
Required: 1. Using the data from 2022 in Gaming Table Cost Data, create an Excel spreadsheet to provide a sensitivity analysis of the effect on operating profit of potential changes in demand for HFI Incorporated, ranging from a 20 percent decrease to a 20 percent increase. Use Contribution Income Statements and What-If Sensitivity Analysis as a guide. Assume that two-thirds of fixed costs are manufacturing related; the remaining one-third are selling-related. The variable manufacturing cost per unit is $30, while the variable selling cost per unit is $5. (Hint: Calculate the DOL for 2022 at a sales volume of 2,400 units.) 2. Using the spreadsheet you created, compute the new operating profit assuming a 10% decrease in demand. Complete this question by entering your answers in the tabs below. Gaming Table Cost Data Contribution Income Statements What If Sensitivity Required 1 Required 2 Analysis Per Unit 2022 2023 Fixed costs (per year) Selling price $ 69,000 $ 69,000 75 Variable cost 35 Planned production Planned sales volume 2,400 units 2,600 units 2,400 units 2,600 units Gaming Table Cost Data Contribution Income Statements Contribution Gaming Table Income What If Sensitivity Required 1 Required 2 Cost Data Statements Analysis 2022 2023 Amount Percent Amount Percent Change Notes Sales $ 180,000 100.00% $ 195,000 100.00 % $ 15,000 Variable costs 84,000 46.67 91,000 46.67 7,000 Total contribution margin $ 96,000 53.33% $ 104,000 53.33 % $ 8,000 53.33% is the contribution margin ratio Fixed costs 60,000 60,000 0 Operating profit $ 36,000 $ 44,000 $ 8,000 $8,000 0.5333 x $15,000 < Gaming Table Cost Data What If Sensitivity Analysis > Gaming Table Cost Data Contribution Income Statements What If Sensitivity Analysis Required 1 Required 2 Units Sold Variable Cost per Unit Selling Price Operating Fixed Costs per Unit Profit 1,500 $ 30 $ 69,000 $ 75 $ 7,500 1,500 35 69,000 75 0 1,500 40 69,000 75 -7,500 1,500 45 69,000 75 -15,000 < Contribution Income Statements Required 1 > Gaming Table Cost Data Contribution Income Statements What If Sensitivity Analysis Required 1 Required 2 Using the data from 2022 in Gaming Table Cost Data, create an Excel spreadsheet to provide a sensitivity analysis of the effect on operating profit of potential changes in demand for HFI Incorporated, ranging from a 20 percent decrease to a 20 percent increase. Use Contribution Income Statements and What-If Sensitivity Analysis as a guide. Assume that two- thirds of fixed costs are manufacturing related; the remaining one-third are selling-related. The variable manufacturing cost per unit is $30, while the variable selling cost per unit is $5. (Hint: Calculate the DOL for 2022 at a sales volume of 2,400 units.) (Input your answer as a percentage rounded to 2 decimal places (i.e., 0.1567 15.67%).) Show less DOL % What If Sensitivity Analysis Required 2 > Gaming Table Cost Data Contribution Income What If Sensitivity Analysis Required 1 Required 2 Statements Using the spreadsheet you created, compute the new operating profit assuming a 10% decrease in demand. Operating profit < Required 1 Required 2 >
Step by Step Solution
There are 3 Steps involved in it
To solve this problem lets go step by step Step 1 Calculate the Degree of Operating Leverage DOL for ... View full answer

Get step-by-step solutions from verified subject matter experts