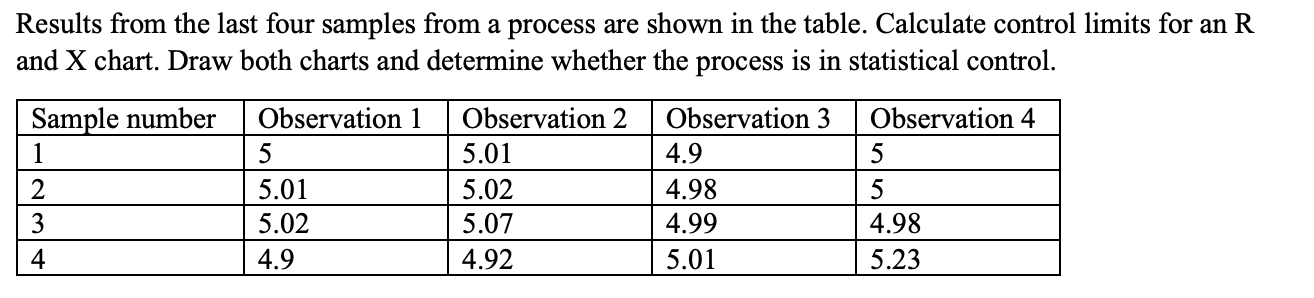
Question: Results from the last four samples from a process are shown in the table. Calculate control limits for an R and X chart. Draw both

Results from the last four samples from a process

Results from the last four samples from a process are shown in the table. Calculate control limits for an R and X chart. Draw both charts and determine whether the process is in statistical control. Sample number 1 2 3 Observation 1 5 5.01 5.02 4.9 Observation 2 5.01 5.02 5.07 4.92 Observation 3 4.9 4.98 4.99 5.01 Observation 4 5 5 4.98 5.23 4

Step by Step Solution

There are 3 Steps involved in it

1 Expert Approved Answer
Step: 1 Unlock blur-text-image
Question Has Been Solved by an Expert!

Get step-by-step solutions from verified subject matter experts

Step: 2 Unlock
Step: 3 Unlock

Students Have Also Explored These Related General Management Questions!