

Question: Table 3.1 Factors for Calculating Three-Sigma Limits for the x Chart and R-Chart Source: 1950 ASTM Manual on Quality Control of Materials. copyright American Society
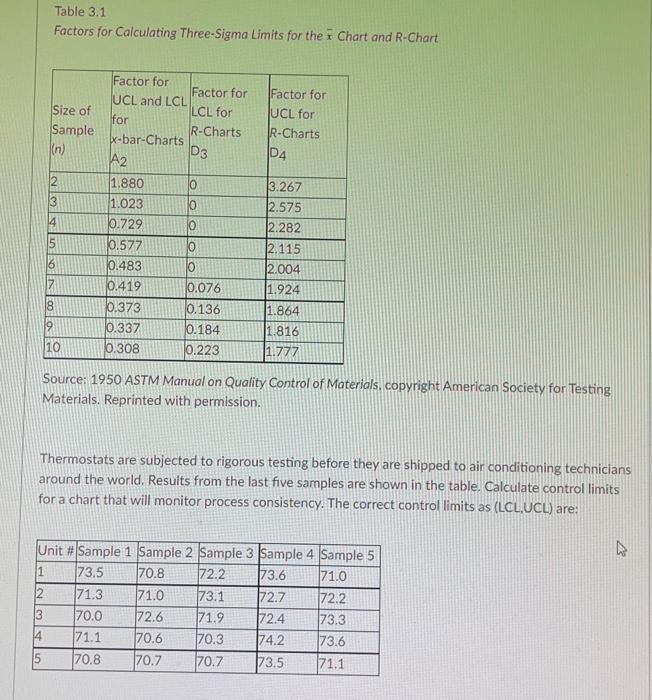
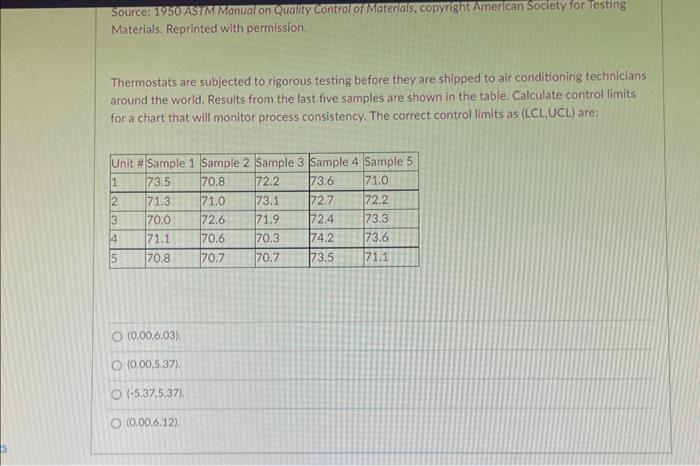
Table 3.1 Factors for Calculating Three-Sigma Limits for the x Chart and R-Chart Source: 1950 ASTM Manual on Quality Control of Materials. copyright American Society for Testing: Materials. Reprinted with permission. Thermostats are subjected to rigorous testing before they are shipped to air conditioning technicians around the world. Resuits from the last five samples are shown in the table. Calculate control limits for a chart that will monitor process consistency. The correct control limits as (LCL.UCL) are: Source: 1950 AStMIManud on Quality Control of Materials, copyright American Soclety for lesting Materials. Reprinted with permission. Thermostats are subjected to rigorous testing before they are shipped to air conditioning technicians around the world. Results from the last five samples are shown in the table. Calculate control limits for a chart that will monitor process consistency. The correct control limits as (LCL.UCL) are: (0.00,6.03) (0.00,5.37) (5.37,5.37) (0.00,6.12)
Step by Step Solution
There are 3 Steps involved in it

Get step-by-step solutions from verified subject matter experts