

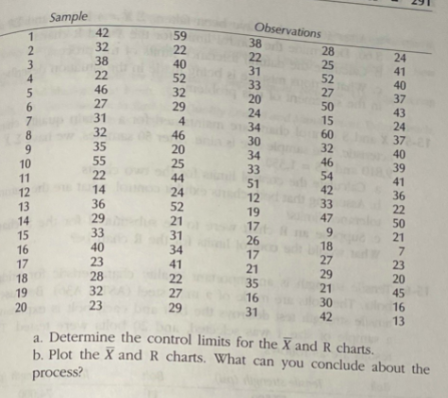
Question: Sample Observations 4 37 atrasavanown mhpBBEPUB 17 a. Determine the control limits for the X and R charts. b. Plot the X and R charts.
Step by Step Solution
There are 3 Steps involved in it
1 Expert Approved Answer
Step: 1 Unlock

Question Has Been Solved by an Expert!
Get step-by-step solutions from verified subject matter experts
Step: 2 Unlock
Step: 3 Unlock