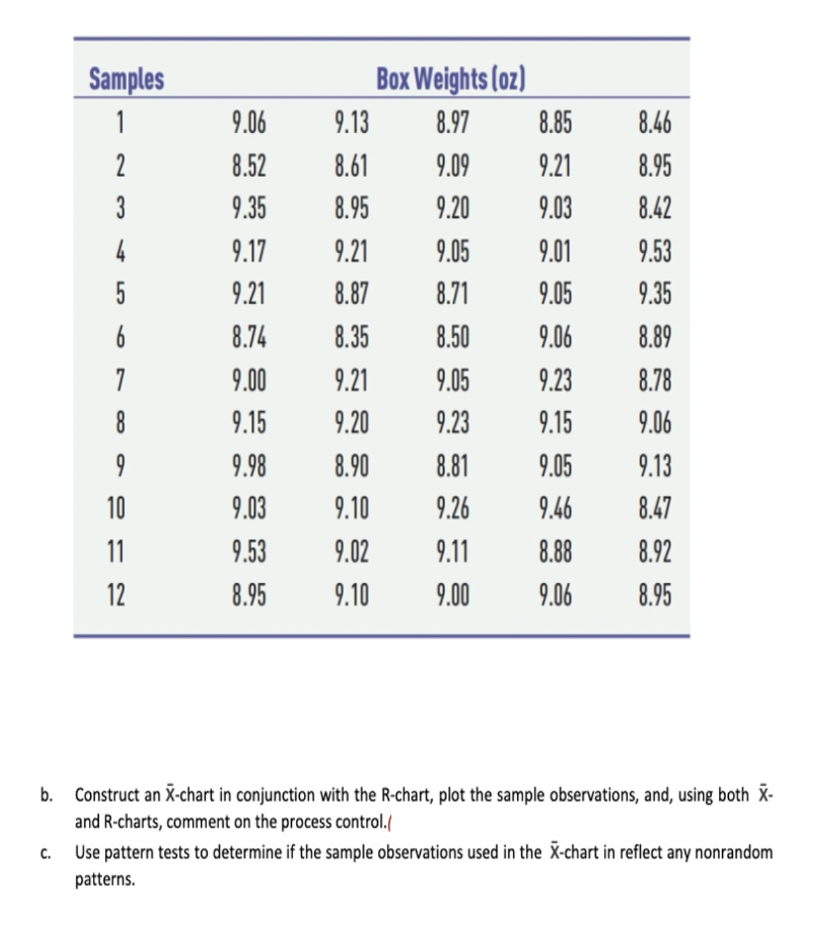
Question: Samples 1 2 3 4 5. 6 9.06 8.52 9.35 9.17 9.21 8.74 9.00 9.15 9.98 9.03 9.53 8.95 Box Weights (oz) 9.13 8.97 8.85

Samples 1 2 3 4 5. 6 9.06 8.52 9.35 9.17 9.21

Samples 1 2 3 4 5. 6 9.06 8.52 9.35 9.17 9.21 8.74 9.00 9.15 9.98 9.03 9.53 8.95 Box Weights (oz) 9.13 8.97 8.85 8.61 9.09 9.21 8.95 9.20 9.03 9.21 9.05 9.01 8.87 8.71 9.05 8.35 8.50 9.06 9.21 9.05 9.23 9.20 9.23 9.15 8.90 8.81 9.05 9.10 9.26 9.46 9.02 9.11 8.88 9.10 9.00 9.06 8.46 8.95 8.42 9.53 9.35 8.89 8.78 9.06 9.13 8.47 8.92 8.95 7. 8 9 10 11 12 Construct an X-chart in conjunction with the R-chart, plot the sample observations, and, using both X- and R-charts, comment on the process control. C. Use pattern tests to determine if the sample observations used in the X-chart in reflect any nonrandom patterns

Step by Step Solution

There are 3 Steps involved in it

1 Expert Approved Answer
Step: 1 Unlock blur-text-image
Question Has Been Solved by an Expert!

Get step-by-step solutions from verified subject matter experts

Step: 2 Unlock
Step: 3 Unlock

Students Have Also Explored These Related General Management Questions!