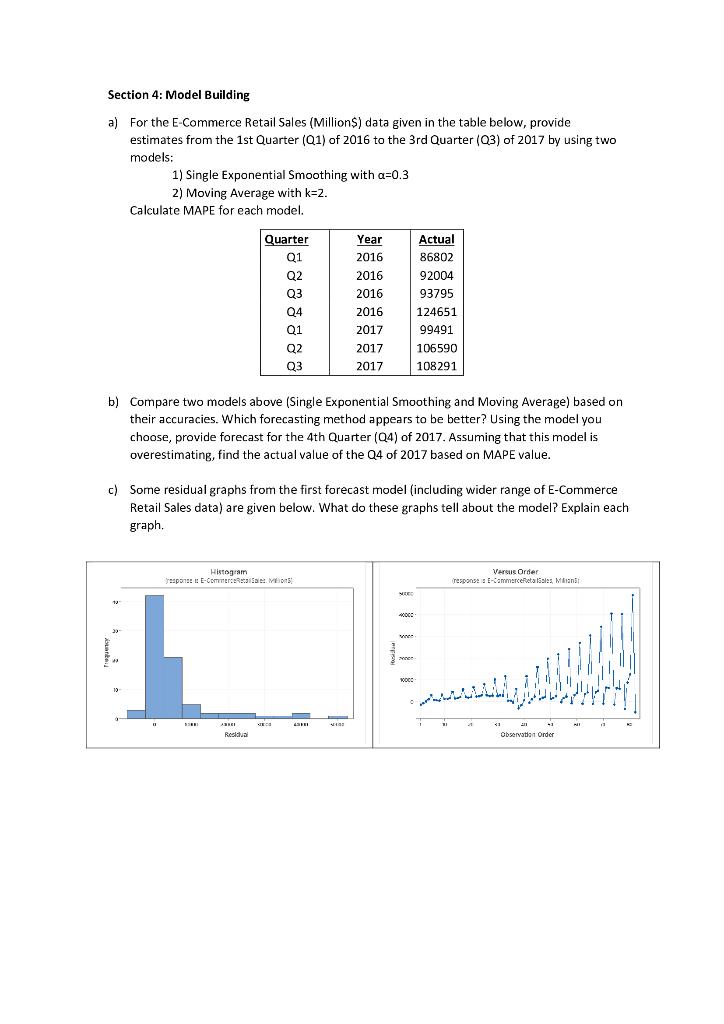
Question: Section 4: Model Building a) For the E-Commerce Retail Sales (Millions) data given in the table below, provide estimates from the 1st Quarter (Q1) of

Section 4: Model Building a) For the E-Commerce

Section 4: Model Building a) For the E-Commerce Retail Sales (Millions) data given in the table below, provide estimates from the 1st Quarter (Q1) of 2016 to the 3rd Quarter (03) of 2017 by using two models: 1) Single Exponential Smoothing with a=0.3 2) Moving Average with k=2. Calculate MAPE for each model. Quarter Q1 Q2 Q3 04 Q1 02 Q3 Year 2016 2016 2016 2016 2017 Actual 86802 92004 93795 124651 99491 106590 108291 2017 2017 b) Compare two models above (Single Exponential Smoothing and Moving Average) based on their accuracies. Which forecasting method appears to be better? Using the model you choose, provide forecast for the 4th Quarter (Q4) of 2017. Assuming that this model is overestimating, find the actual value of the Q4 of 2017 based on MAPE value. c) Some residual graphs from the first forecast model (including wider range of E-Commerce Retail Sales data) are given below. What do these graphs tell about the model? Explain each graph. Histogram Trap E-COMMERCE Versus Order response sommerce et Sales Man 000 30 w wo c CE SI

Step by Step Solution

There are 3 Steps involved in it

1 Expert Approved Answer
Step: 1 Unlock blur-text-image
Question Has Been Solved by an Expert!

Get step-by-step solutions from verified subject matter experts

Step: 2 Unlock
Step: 3 Unlock

Students Have Also Explored These Related General Management Questions!