

Question: see attached. worker to worker e this effect by selecting a random sample of 12 workers and timing each worker on each assembly process. Half
see attached.
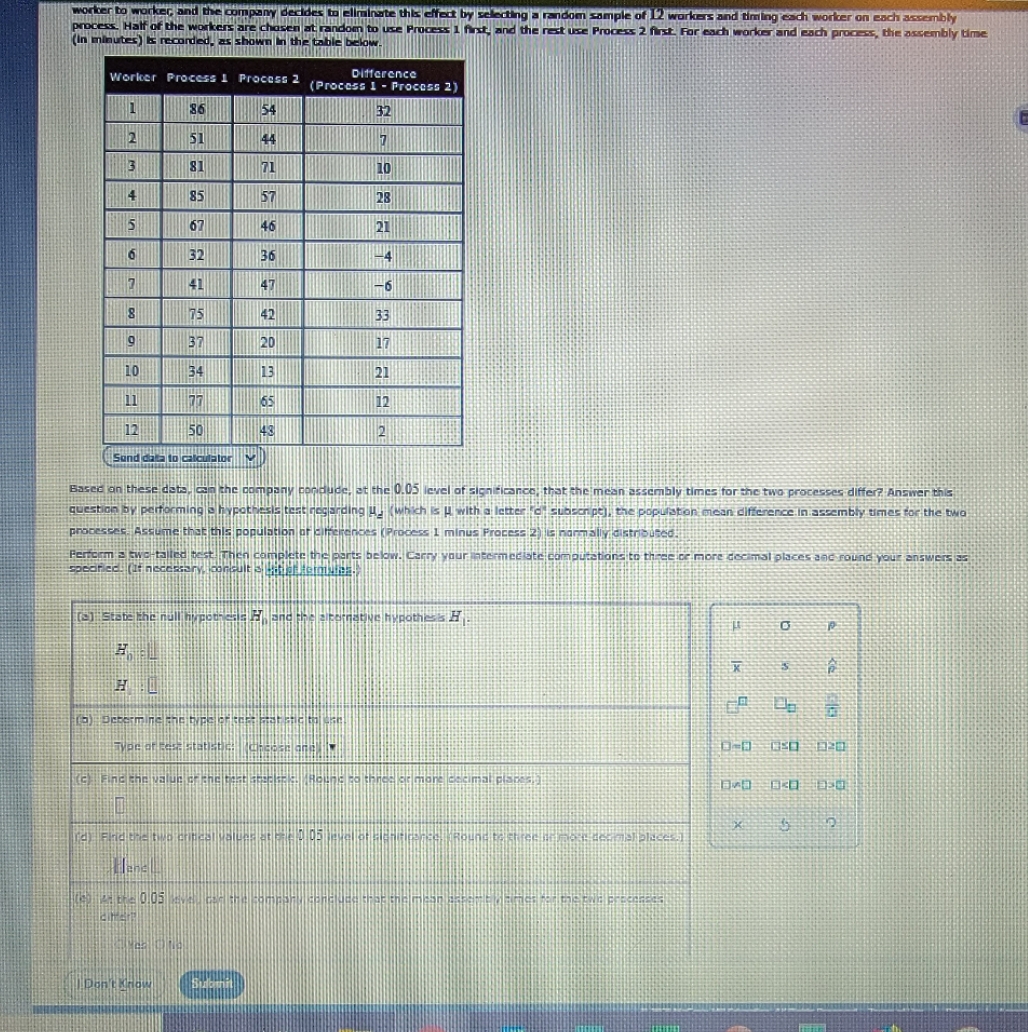
worker to worker e this effect by selecting a random sample of 12 workers and timing each worker on each assembly process. Half of the workers are chosen at random to use Process 1 first and the rest use Process 2 first. For each worker and each process, the assembly time (In minutes) & recorded Worker Process 1 Process 2 Difference (Process 1 - Process 2) 86 154 32 51 44 7 81 71 10 85 57 28 5 67 46 21 32 36 41 47 -6 8 75 42 33 37 20 17 10 134 13 21 11 75 65 12 12 150 43 2 Sand data to calculator Basce on these data. ques. at the 0.05 level of significance, that the mean assembly times for the two processes differ? Answer this question BY performing s hypothes ording Hy (which is A with a letter to subscript], the pop San difference in assembly timer for the two processes. Assume thes this population a cess 1 minus Process 2) = normally distressed Perform'S twostalled test. then complete the carry your Ine mutations to t c more decimal places and found your answers as (SJ State the null hypothe H X El Fine she value a the meat
Step by Step Solution
There are 3 Steps involved in it

Get step-by-step solutions from verified subject matter experts