

Question: See Table 2.5 B showing financial statement data and stock price data for Mydeco Corp. a. What is Mydeco's market capitalization at the end of
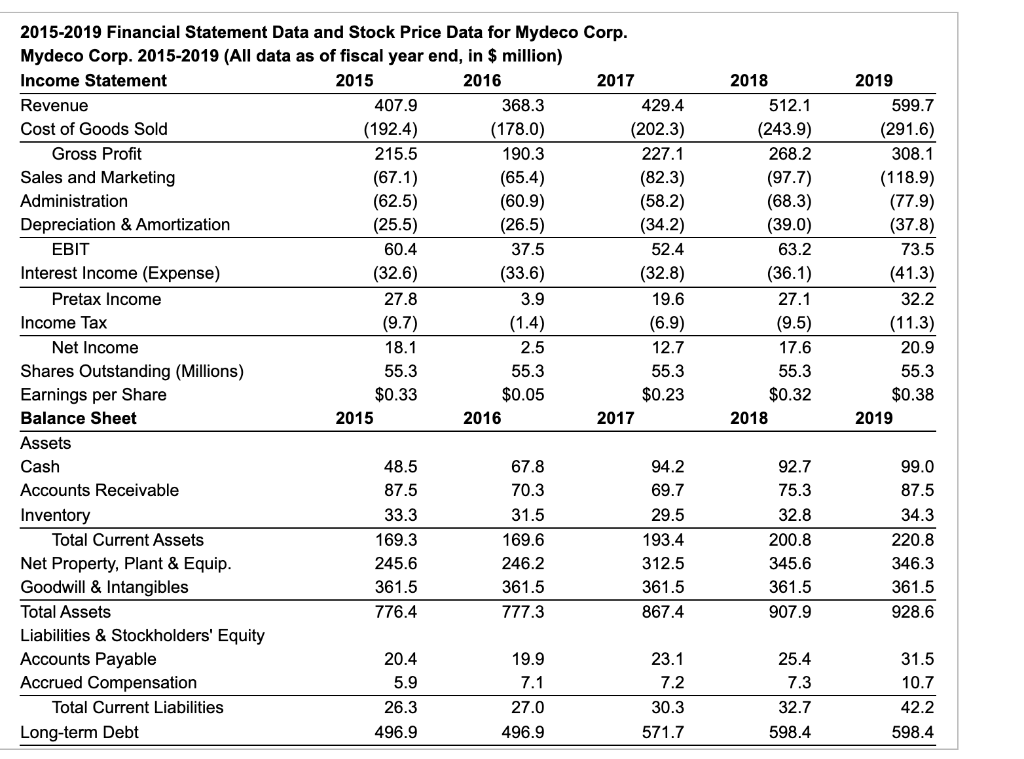
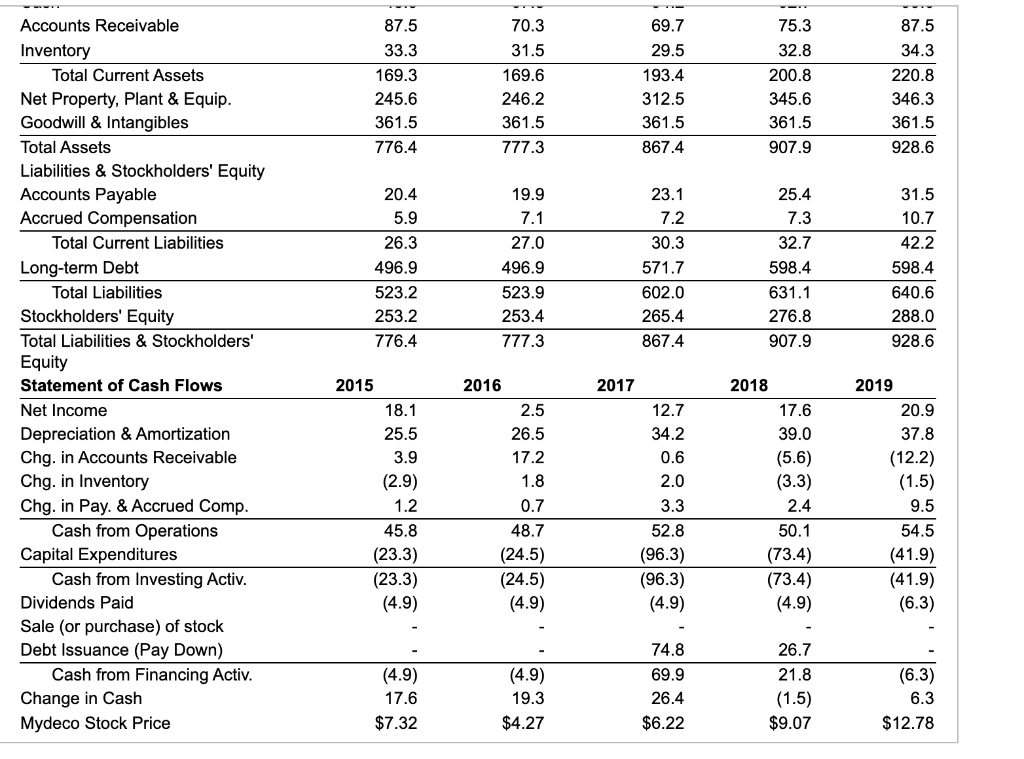
See Table 2.5 B showing financial statement data and stock price data for Mydeco Corp. a. What is Mydeco's market capitalization at the end of each year? b. What is Mydeco's market-to-book ratio at the end of each year? c. What is Mydeco's enterprise value at the end of each year? 2015-2019 Financial Statement Data and Stock Price Data for Mydeco Corp. Mydeco Corp. 2015-2019 (All data as of fiscal year end, in $ million) Income Statement 2015 2016 2017 Revenue 407.9 368.3 429.4 Cost of Goods Sold (192.4) (178.0) (202.3) Gross Profit 215.5 190.3 227.1 Sales and Marketing (67.1) (65.4) (82.3) Administration (62.5) (60.9) (58.2) Depreciation & Amortization (25.5) (26.5) (34.2) EBIT 60.4 37.5 52.4 Interest Income (Expense) (32.6) (33.6) (32.8) Pretax Income 27.8 3.9 19.6 Income Tax (9.7) (1.4) (6.9) Net Income 18.1 2.5 12.7 Shares Outstanding (Millions) 55.3 55.3 55.3 Earnings per Share $0.33 $0.05 $0.23 Balance Sheet 2015 2016 2017 Assets Cash 48.5 67.8 94.2 Accounts Receivable 87.5 70.3 69.7 Inventory 33.3 31.5 29.5 Total Current Assets 169.3 169.6 193.4 Net Property, Plant & Equip. 245.6 246.2 312.5 Goodwill & Intangibles 361.5 361.5 361.5 Total Assets 776.4 777.3 867.4 Liabilities & Stockholders' Equity Accounts Payable 20.4 19.9 23.1 Accrued Compensation 5.9 7.1 7.2 Total Current Liabilities 26.3 27.0 30.3 Long-term Debt 496.9 496.9 571.7 2018 512.1 (243.9) 268.2 (97.7) (68.3) (39.0) 63.2 (36.1) 27.1 (9.5) 17.6 55.3 $0.32 2018 2019 599.7 (291.6) 308.1 (118.9) (77.9) (37.8) 73.5 (41.3) 32.2 (11.3) 20.9 55.3 $0.38 2019 92.7 75.3 32.8 200.8 345.6 361.5 907.9 99.0 87.5 34.3 220.8 346.3 361.5 928.6 25.4 7.3 32.7 598.4 31.5 10.7 42.2 598.4 87.5 33.3 169.3 245.6 361.5 776.4 70.3 31.5 169.6 246.2 361.5 777.3 69.7 29.5 193.4 312.5 361.5 867.4 75.3 32.8 200.8 345.6 361.5 907.9 87.5 34.3 220.8 346.3 361.5 928.6 20.4 5.9 26.3 496.9 523.2 253.2 776.4 19.9 7.1 27.0 496.9 523.9 253.4 777.3 23.1 7.2 30.3 571.7 602.0 265.4 867.4 25.4 7.3 32.7 598.4 631.1 276.8 907.9 31.5 10.7 42.2 598.4 640.6 288.0 928.6 Accounts Receivable Inventory Total Current Assets Net Property, Plant & Equip. Goodwill & Intangibles Total Assets Liabilities & Stockholders' Equity Accounts Payable Accrued Compensation Total Current Liabilities Long-term Debt Total Liabilities Stockholders' Equity Total Liabilities & Stockholders' Equity Statement of Cash Flows Net Income Depreciation & Amortization Chg. in Accounts Receivable Chg. in Inventory Chg. in Pay. & Accrued Comp. Cash from Operations Capital Expenditures Cash from Investing Activ. Dividends Paid Sale (or purchase) of stock Debt Issuance (Pay Down) Cash from Financing Activ. Change in Cash Mydeco Stock Price 2015 18.1 25.5 3.9 (2.9) 1.2 45.8 (23.3) (23.3) (4.9) 2016 2.5 26.5 17.2 1.8 0.7 48.7 (24.5) (24.5) (4.9) 2017 12.7 34.2 0.6 2.0 3.3 52.8 (96.3) (96.3) (4.9) 2018 17.6 39.0 (5.6) (3.3) 2.4 50.1 (73.4) (73.4) (4.9) 2019 20.9 37.8 (12.2) (1.5) 9.5 54.5 (41.9) (41.9) (6.3) (4.9) 17.6 $7.32 (4.9) 19.3 $4.27 74.8 69.9 26.4 $6.22 26.7 21.8 (1.5) $9.07 (6.3) 6.3 $12.78
Step by Step Solution
There are 3 Steps involved in it

Get step-by-step solutions from verified subject matter experts