

Question: Select the correct histogram for the above data The table shows the annual compensation of' 40 randomly chosen C30y pilliers of dullers 5 5. HI
Select the correct histogram for the above data
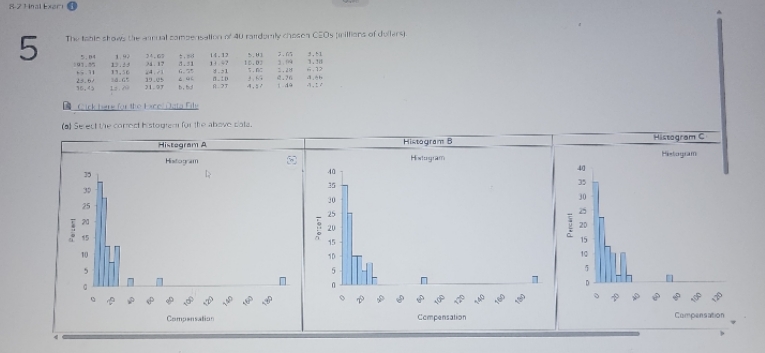
The table shows the annual compensation of' 40 randomly chosen C30y pilliers of dullers 5 5. HI 14 47 1-14 (al se eud the correct Istoyten for the ahave cala. Hi bagram A Histogram B Hislagiam Hulagram 10 - 30 25 25 20 Percent 15 Compensation Companiation Compansation
Step by Step Solution
There are 3 Steps involved in it
1 Expert Approved Answer
Step: 1 Unlock

Question Has Been Solved by an Expert!
Get step-by-step solutions from verified subject matter experts
Step: 2 Unlock
Step: 3 Unlock