

Question: Selected comparative financial statement data for Golden Valley Inc. are shown below. GOLDEN VALLEY INC. Statement of Financial Position (partial) December 31 (in thousands) 2021
Selected comparative financial statement data for Golden Valley Inc. are shown below.
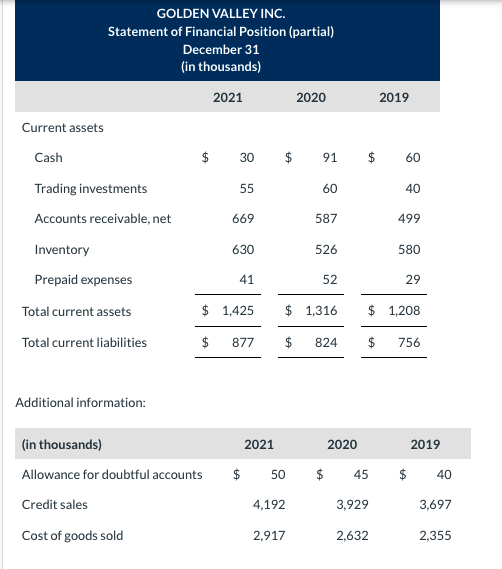
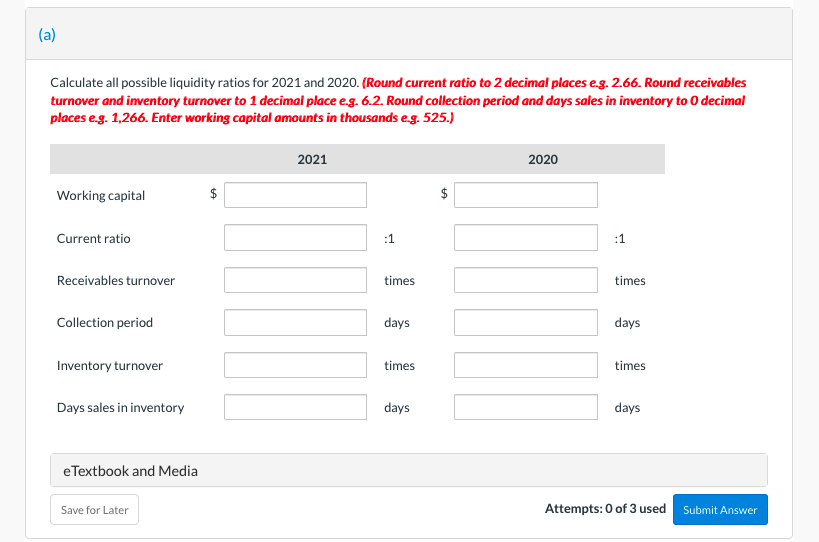
GOLDEN VALLEY INC. Statement of Financial Position (partial) December 31 (in thousands) 2021 2020 $ 91 60 587 526 52 $ 1,316 824 Current assets Cash Trading investments Accounts receivable, net Inventory Prepaid expenses Total current assets Total current liabilities Additional information: (in thousands) Allowance for doubtful accounts Credit sales Cost of goods sold $ 30 55 669 630 41 $ 1,425 $ 877 $ 2019 60 40 499 580 29 $ 1,208 $ 756 2021 2020 2019 $ 50 $ 45 $ 40 4,192 3,929 3,697 2,917 2,632 2,355 (a) Calculate all possible liquidity ratios for 2021 and 2020. (Round current ratio to 2 decimal places e.g. 2.66. Round receivables turnover and inventory turnover to 1 decimal place e.g. 6.2. Round collection period and days sales in inventory to O decimal places e.g. 1,266. Enter working capital amounts in thousands e.g. 525.) 2021 2020 Working capital Current ratio :1 :1 Receivables turnover times times Collection period days days Inventory turnover times times Days sales in inventory days days eTextbook and Media Attempts: 0 of 3 used
Step by Step Solution
There are 3 Steps involved in it

Get step-by-step solutions from verified subject matter experts