

Question: Selected comparative financial statement data for Pearl City Inc. are shown below. 2019 PEARL CITY INC. Statement of Financial Position (partial) December 31 (in thousands)
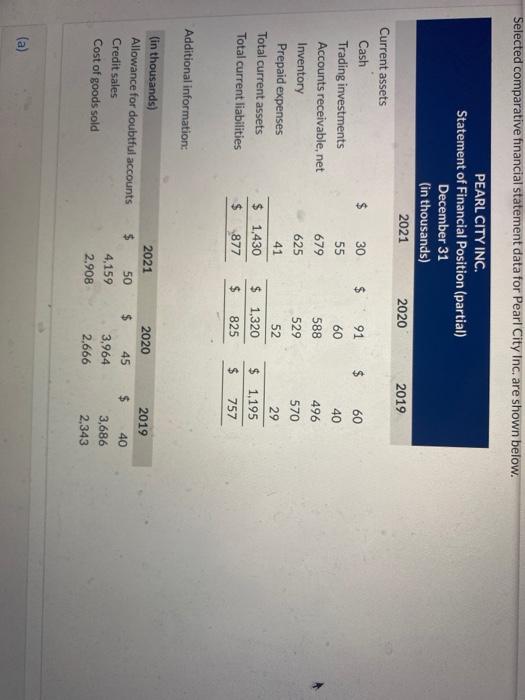
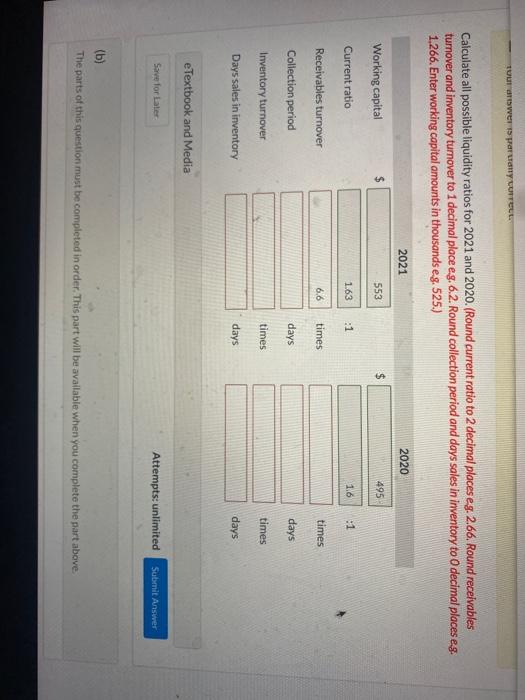
Selected comparative financial statement data for Pearl City Inc. are shown below. 2019 PEARL CITY INC. Statement of Financial Position (partial) December 31 (in thousands) 2021 2020 Current assets Cash $ 30 $ 91 Trading investments 55 60 Accounts receivable, net 679 588 Inventory 625 529 Prepaid expenses 52 Total current assets $ 1.430 $ 1,320 Total current liabilities $ 877 $ 825 $ $ 60 40 496 570 41 29 $ 1,195 $ 757 Additional information: 2020 2019 (in thousands) Allowance for doubtful accounts Credit sales Cost of goods sold 2021 $ 50 4.159 2.908 45 3,964 2.666 40 3,686 2,343 (a) Towers prarany UTTEL Calculate all possible liquidity ratios for 2021 and 2020. (Round current ratio to 2 decimal places eg. 2.66. Round receivables turnover and inventory turnover to 1 decimal place eg. 6.2. Round collection period and days sales in inventory to O decimal places e.g. 1.266. Enter working capital amounts in thousands eg. 525.) 2021 2020 Working capital 553 $ 495 Current ratio 1.63 :1 1.6 1 6,6 times times Receivables turnover Collection period days days Inventory turnover times times Days sales in inventory days days eTextbook and Media Sarve for Later Attempts: unlimited Submit Answer (b) The parts of this question must be completed in order. This part will be available when you complete the part above
Step by Step Solution
There are 3 Steps involved in it

Get step-by-step solutions from verified subject matter experts