

Question: Selected comparative financial statement data for Tri Town Inc. are shown below. 2019 TRI TOWN INC. Statement of Financial Position (partial) December 31 (in thousands)
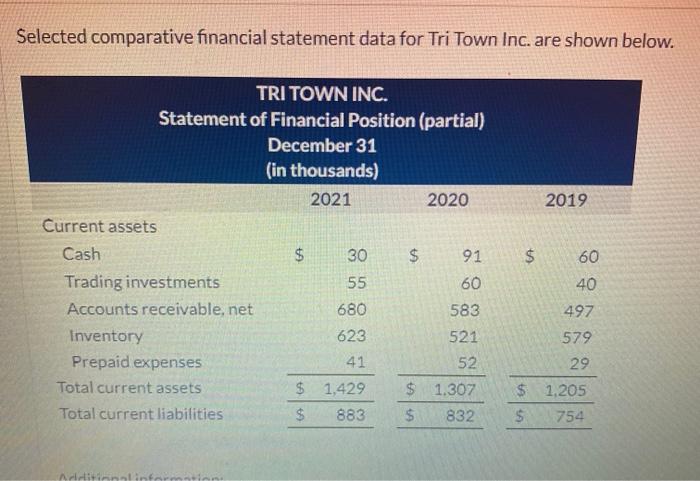
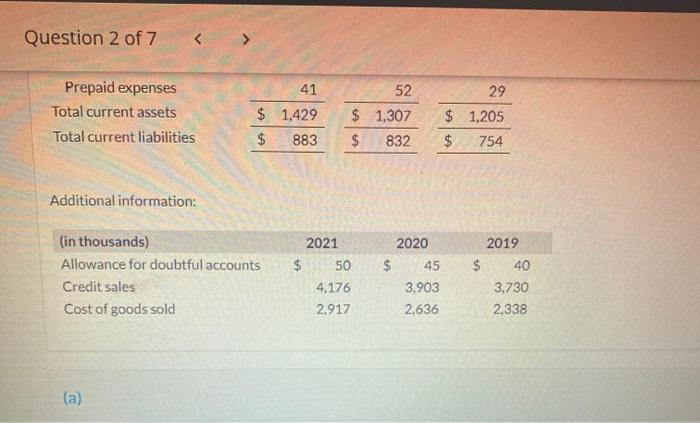
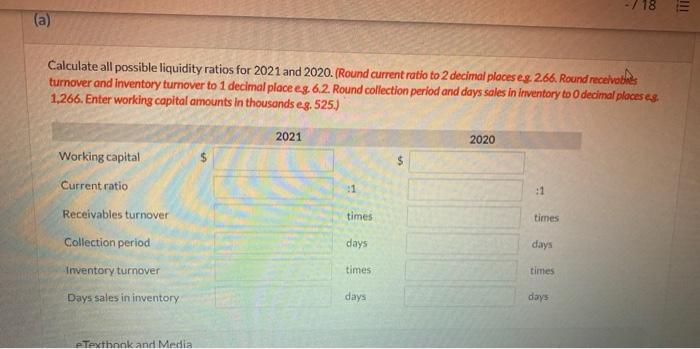
Selected comparative financial statement data for Tri Town Inc. are shown below. 2019 TRI TOWN INC. Statement of Financial Position (partial) December 31 (in thousands) 2021 2020 Current assets Cash $ 30 $ 91 Trading investments 55 60 Accounts receivable, net 680 583 Inventory 623 521 Prepaid expenses 41 Total current assets $ 1,429 $ 1.307 Total current liabilities $ 883 $ 832 $ 60 40 497 579 29 52 $ 1.205 $ 754 Aristitininal Question 2 of 7 41 52 Prepaid expenses Total current assets Total current liabilities $ 1,429 $ 883 $ 1.307 $ 832 29 $ 1,205 $ 754 Additional information: (in thousands) Allowance for doubtful accounts Credit sales Cost of goods sold 2021 $ 50 4,176 2.917 2020 $ 45 3.903 2.636 2019 $ 40 3,730 2.338 (a) - 718 (a) Calculate all possible liquidity ratios for 2021 and 2020. (Round current ratio to 2 decimal places eg. 266. Round receives turnover and inventory turnover to 1 decimal place eg 6.2. Round collection period and days sales in Inventory to decimal places es 1,266. Enter working capital amounts in thousands eg. 525.) 2021 2020 Working capital :1 times times Current ratio Receivables turnover Collection period Inventory turnover Days sales in inventory days days times times days days e Textbook and Media
Step by Step Solution
There are 3 Steps involved in it

Get step-by-step solutions from verified subject matter experts