

Question: Selected comparative financial statement data for Oak Ridge Inc. are shown below. OAK RIDGE INC. Statement of Financial Position (partial) December 31 (in thousands) 2021
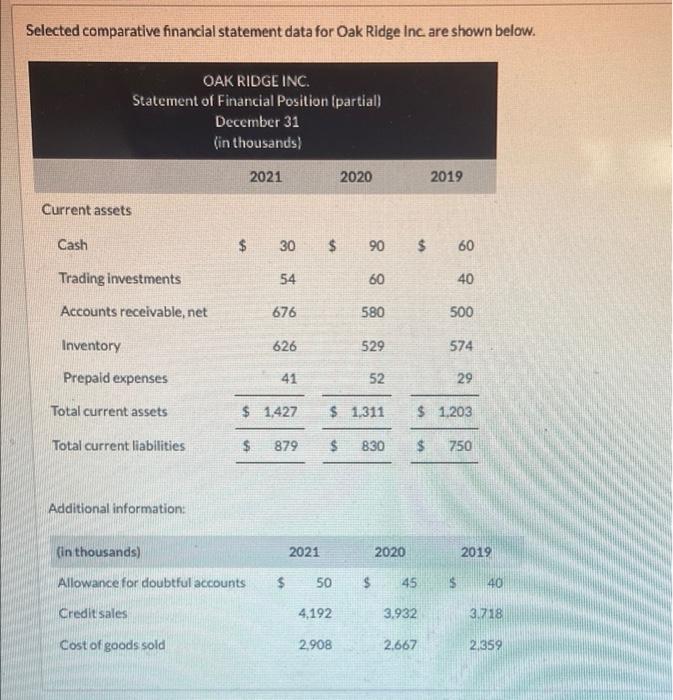
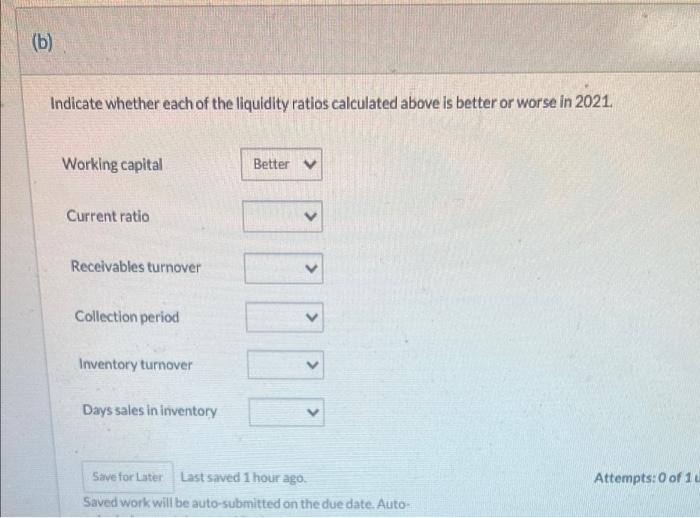
Selected comparative financial statement data for Oak Ridge Inc. are shown below. OAK RIDGE INC. Statement of Financial Position (partial) December 31 (in thousands) 2021 2020 2019 Current assets Cash $ 30 $ 90 $ 60 Trading investments 54 60 40 Accounts receivable, net 676 580 500 Inventory 626 529 574 Prepaid expenses 41 52 29 Total current assets $ 1,427 $ 1.311 $ 1.203 Total current liabilities $ 879 830 $ 750 Additional information: (in thousands) 2021 2020 2019 Allowance for doubtful accounts $50 $ 45 5 40 Credit sales 4,192 3.932 3.718 Cost of goods sold 2.908 2.667 2.359 (b) Indicate whether each of the liquidity ratios calculated above is better or worse in 2021 Working capital Better Current ratio Receivables turnover Collection period Inventory turnover > Days sales in inventory
Step by Step Solution
There are 3 Steps involved in it

Get step-by-step solutions from verified subject matter experts