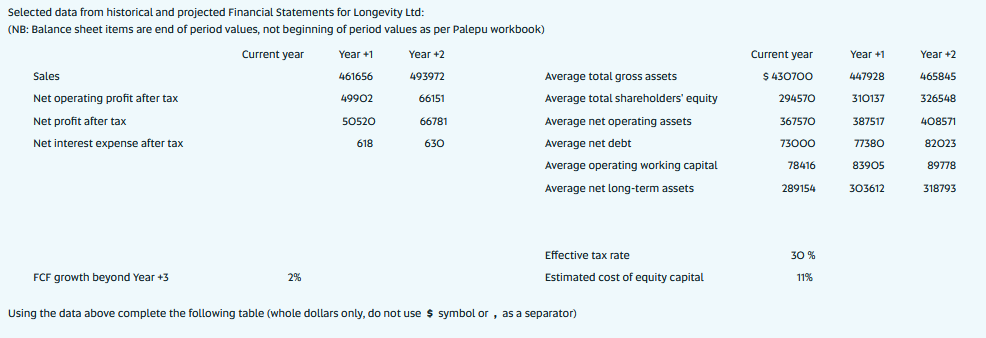
Question: Selected data from historical and projected Financial Statements for Longevity Ltd: (NB: Balance sheet items are end of period values, not beginning of period values

Selected data from historical and projected
Selected data from historical and projected Financial Statements for Longevity Ltd: (NB: Balance sheet items are end of period values, not beginning of period values as per Palepu workbook} Current year Year +1 Year +2 Sales 61656 93911 Average total gross assets Net operating prot after tax 149902 66151 Average total shareholders' equity Net prot after tax 50520 66131 Average net operating assets Net interest expense after tax 613 630 Average net debt Average operating working capitaL Average net Long-term assets Effective tax late FCF growth beyond Tear +3 2% Btimaned cost of equity capital Using the data above complete the following table l[whole dollars onLy, do not use 9 symbol or , as a separator) Cu rre nt yea r s 30100 29610 361510 13000 ran-1r: 28915:: 30 '31: 1156 Year 41 \"1928 310131 381511 11380 83905 3031512 'rear 42 GEMS 3165143 1408511 32013 59113 318193

Step by Step Solution

There are 3 Steps involved in it

1 Expert Approved Answer
Step: 1 Unlock blur-text-image
Question Has Been Solved by an Expert!

Get step-by-step solutions from verified subject matter experts

Step: 2 Unlock
Step: 3 Unlock

Students Have Also Explored These Related Finance Questions!