

Question: Selected data from historical and projected Financial Statements for Johnson Industries: (NB: Balance sheet items are end of period values, not beginning of period values
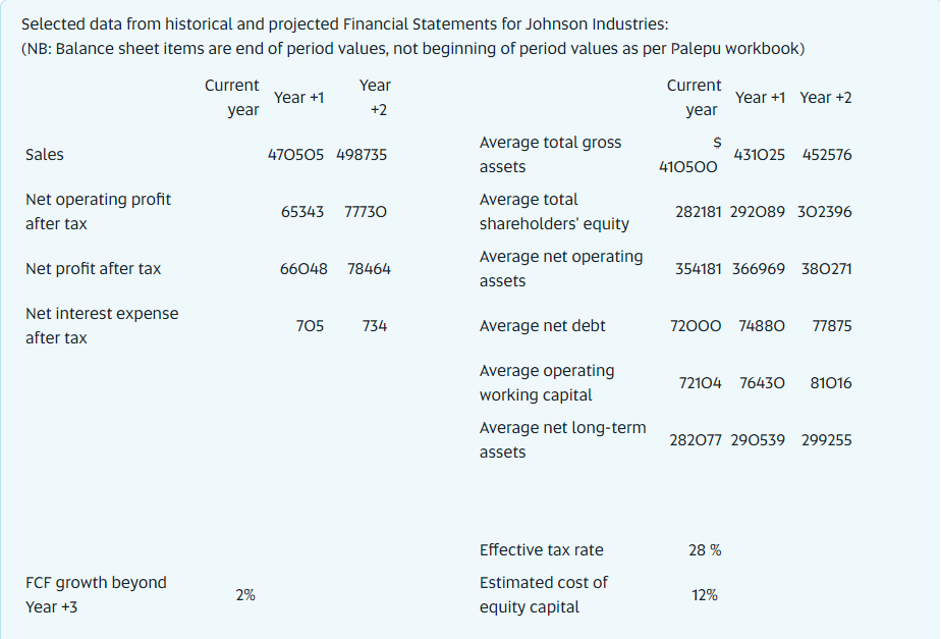
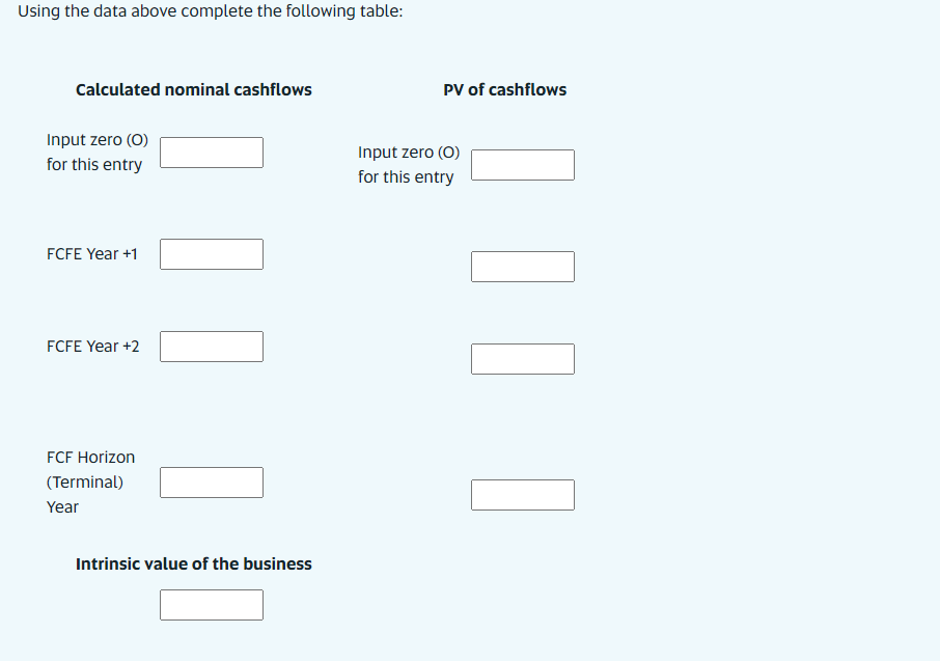
Selected data from historical and projected Financial Statements for Johnson Industries: (NB: Balance sheet items are end of period values, not beginning of period values as per Palepu workbook) Current Year Current Year +1 Year +1 Year +2 year +2 year Sales $ 470505 498735 Average total gross 431025 452576 assets 410500 Net operating profit Average total 65343 77730 after tax 282181 292089 302396 shareholders' equity Net profit after tax 66048 78464 Average net operating 354181 366969 380271 assets Net interest expense 705 734 after tax Average net debt 72000 74880 77875 Average operating 72104 76430 81016 working capital Average net long-term 282077 290539 299255 assets 28 % FCF growth beyond Year +3 Effective tax rate Estimated cost of equity capital 2% 12% Using the data above complete the following table: Calculated nominal cashflows PV of cashflows Input zero (O) for this entry Input zero (0) for this entry FCFE Year +1 FCFE Year +2 FCF Horizon (Terminal) Year Intrinsic value of the business
Step by Step Solution
There are 3 Steps involved in it

Get step-by-step solutions from verified subject matter experts