

Question: Show by plotting the variation of viscosity with temperature that as temperature increases viscosity of Na at low density increases. Take temperature range as 300,
Show by plotting the variation of viscosity with temperature that as temperature increases viscosity of Na at
low density increases. Take temperature range as 300, 400, 450. 500 and S50 K and 1 atm. Use kinetic theory
approach to calculate the viscosity.
Given:
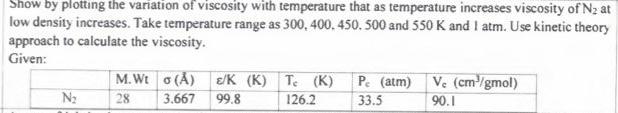
Show by plotting the variation of viscosity with temperature that as temperature increases viscosity of Nz at low density increases. Take temperature range as 300,400.450.500 and 550 K and I atm. Use kinetic theory approach to calculate the viscosity. Given: M. Wt 0() /K (K) T(K) Pc (atm) V. (cm/gmol) N2 28 3.667 99.8 126.2 33.5 90.1
Step by Step Solution
There are 3 Steps involved in it
1 Expert Approved Answer
Step: 1 Unlock

Question Has Been Solved by an Expert!
Get step-by-step solutions from verified subject matter experts
Step: 2 Unlock
Step: 3 Unlock