

Question: show excel formulas in calculations and =formulatext or explain EXMIBIT 7.12 Monthly excess retum data for two porticlios and three risk factors Problems 4 and
show excel formulas in calculations and =formulatext or explain
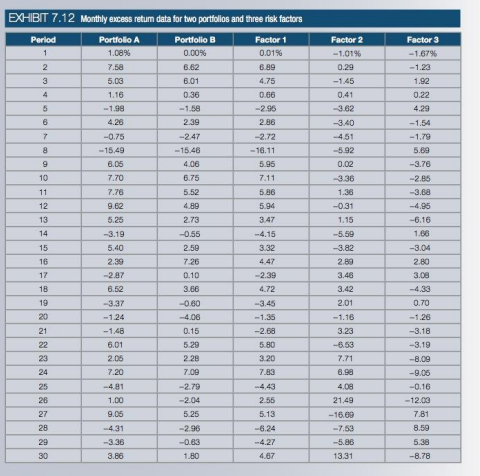
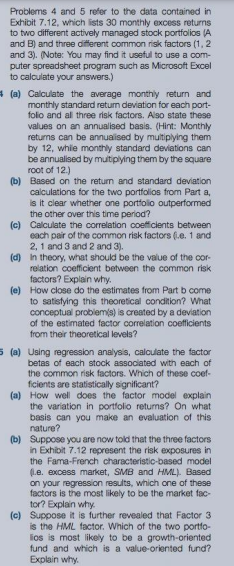
EXMIBIT 7.12 Monthly excess retum data for two porticlios and three risk factors Problems 4 and 5 refer to the data contained in Exhibit 7.12, which ists 30 monthly excess retums to two different actively managed stock portfolios (A) and B) and three oitferent common risk factors (1, 2 and 3). (Noter: You may find it useful to use a computer spreadsheet program such as Microsott Excel to calculate your answers.) (a) Calculate the average monthily return and monthly standard return deviation for each portfolo and al three risk factors. Also state these values on an annualised basis. (Hint: Monthly returns can be annuaised by multiplying them by 12 , whie monthly standard devations can be annualised by mutiplying them by the square root of 12.) (b) Based on the retum and standard deviation calculations for the two portfolios from Part a, is it clear whether one portiolio outperformed the other over this time period? (c) Calculate the correlation coefficlents between each pair of the common risk factors f.e. 1 and 2,1 and 3 and 2 and 3 ). (d) In theory, what should be the value of the correlation coefficient between the common risk factors? Explain why. (e) How close do the estimates from Part b come to satisfying this theoretical condition? What conceptual probiem(s) is created by a deviation of the estimated factor correlation coetlicients from their theoretical levels? (a) Using regression analysis, calculate the factor betas of each stock assoclated with each of the common risk factors. Which of these coetficients are statistically significant? (a) How well does the factor model explain the variation in portfolio retums? On what basis can you make an evaluation of this nature? (b) Suppose you are now toid that the three factors in Exhibit 7.12 represent the risk exposures in the Fama-French characteristic-based model (1.e. excess market, SMB and HML). Based on your regression results, which one of these factors is the most likely to be the market factor? Explain why. (c) Suppose it is further revealed that Factor 3 is the HML tactor. Which of the two portloIios is most likely to be a growth-oriented fund and which is a value-oriented fund? Explain why. EXMIBIT 7.12 Monthly excess retum data for two porticlios and three risk factors Problems 4 and 5 refer to the data contained in Exhibit 7.12, which ists 30 monthly excess retums to two different actively managed stock portfolios (A) and B) and three oitferent common risk factors (1, 2 and 3). (Noter: You may find it useful to use a computer spreadsheet program such as Microsott Excel to calculate your answers.) (a) Calculate the average monthily return and monthly standard return deviation for each portfolo and al three risk factors. Also state these values on an annualised basis. (Hint: Monthly returns can be annuaised by multiplying them by 12 , whie monthly standard devations can be annualised by mutiplying them by the square root of 12.) (b) Based on the retum and standard deviation calculations for the two portfolios from Part a, is it clear whether one portiolio outperformed the other over this time period? (c) Calculate the correlation coefficlents between each pair of the common risk factors f.e. 1 and 2,1 and 3 and 2 and 3 ). (d) In theory, what should be the value of the correlation coefficient between the common risk factors? Explain why. (e) How close do the estimates from Part b come to satisfying this theoretical condition? What conceptual probiem(s) is created by a deviation of the estimated factor correlation coetlicients from their theoretical levels? (a) Using regression analysis, calculate the factor betas of each stock assoclated with each of the common risk factors. Which of these coetficients are statistically significant? (a) How well does the factor model explain the variation in portfolio retums? On what basis can you make an evaluation of this nature? (b) Suppose you are now toid that the three factors in Exhibit 7.12 represent the risk exposures in the Fama-French characteristic-based model (1.e. excess market, SMB and HML). Based on your regression results, which one of these factors is the most likely to be the market factor? Explain why. (c) Suppose it is further revealed that Factor 3 is the HML tactor. Which of the two portloIios is most likely to be a growth-oriented fund and which is a value-oriented fund? Explain why
Step by Step Solution
There are 3 Steps involved in it

Get step-by-step solutions from verified subject matter experts