

Question: show work AON network diagram: B Crash Normal Time (weeks) Normal Crash Time (weeks) Crash Cost (5) Maximum weeks Reduced Cost per Week ($) Activity
show work 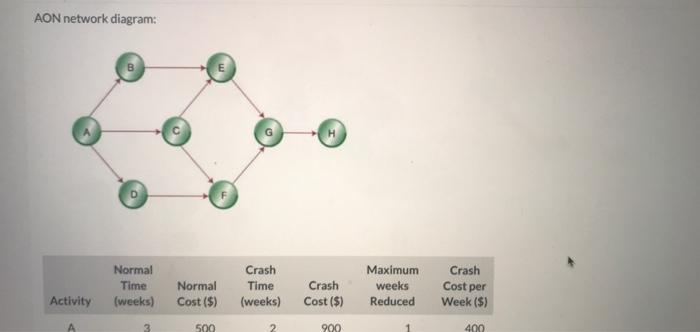
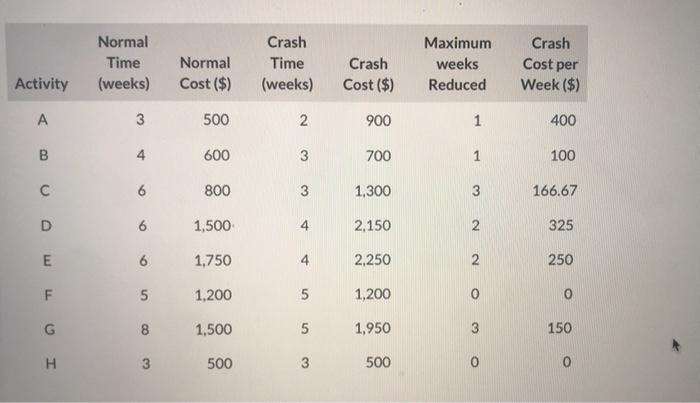
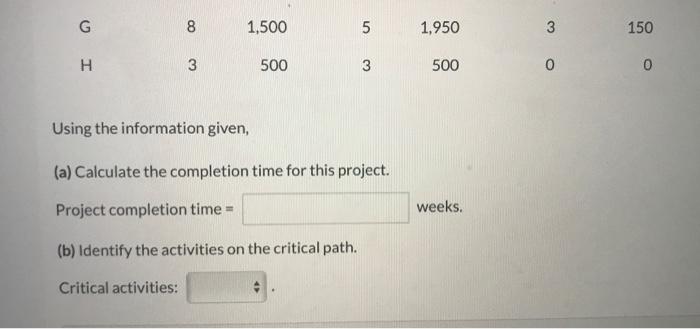
AON network diagram: B Crash Normal Time (weeks) Normal Crash Time (weeks) Crash Cost (5) Maximum weeks Reduced Cost per Week ($) Activity Cost ($) 500 2 900 400 Normal Crash Maximum Crash Time Normal Cost ($) Time (weeks) Crash Cost ($) weeks Reduced Cost per Week ($) Activity (weeks) A 3 500 2 900 1 400 00 4 600 3 700 1 100 6 800 3 1,300 3 166.67 D 6 1,500 4 2,150 2 325 6. 1,750 4 2.250 2 250 5 1,200 5 1,200 I 8 1,500 5 1,950 O O 3 150 3 500 3 500 G 8 1,500 5 5 1,950 3 150 H 3 500 3 3 500 0 0 Using the information given, (a) Calculate the completion time for this project. Project completion time - weeks. (b) Identify the activities on the critical path. Critical activities
Step by Step Solution
There are 3 Steps involved in it
1 Expert Approved Answer
Step: 1 Unlock

Question Has Been Solved by an Expert!
Get step-by-step solutions from verified subject matter experts
Step: 2 Unlock
Step: 3 Unlock