

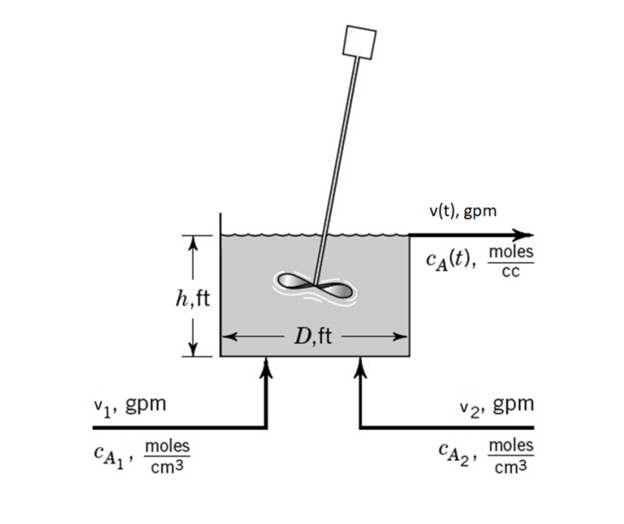
Question: Simulate the mixing process shown below using Simulink and plot the response of the outlet concentration and flow to a step increase of 2 .
Simulate the mixing process shown below using Simulink and plot the response of the outlet concentration and
flow to a step increase of gpm in the flow of the first inlet stream, followed five minutes later by a step
increase of gpm in the flow of the second inlet stream. The density of all streams is very similar and inlet
compositions can be assumed constant. Tank volume Ah is constant at gallons due to a tight level
control. Stream and Stream inlet concentrations are constant at and molcm respectively. At the
initial steady state conditions, the outlet flow from the tank was gpm at a concentration of molescm
Properly label your Simulink diagram and trend.
Step by Step Solution
There are 3 Steps involved in it
1 Expert Approved Answer
Step: 1 Unlock

Question Has Been Solved by an Expert!
Get step-by-step solutions from verified subject matter experts
Step: 2 Unlock
Step: 3 Unlock