

Question: Soe Table 2.5 T showing financial statement data and stock price data for ydeco Corp. Was Mydeco able to improve its return on invested capital
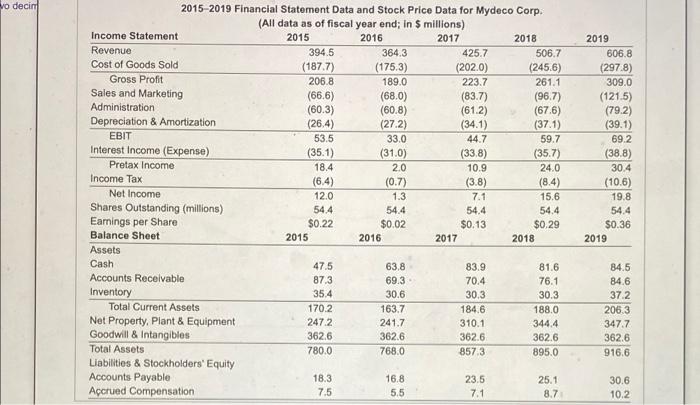
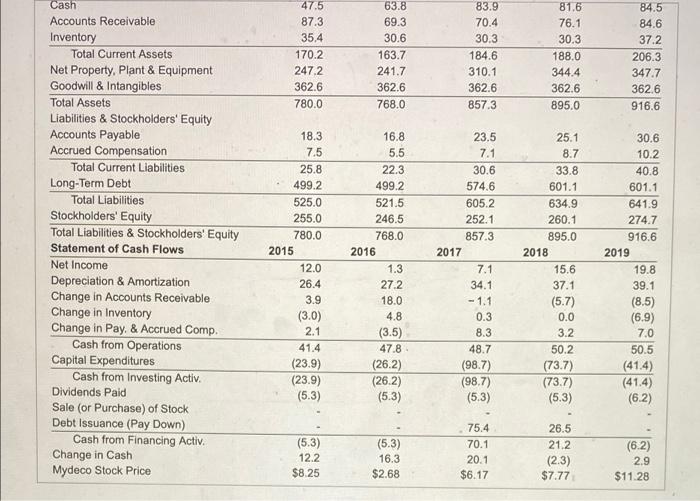
Soe Table 2.5 T showing financial statement data and stock price data for ydeco Corp. Was Mydeco able to improve its return on invested capital (ROIC) in 2019 relative to what it was in 2015 The ROIC for 2015 % (Round to two decimal places) vo decin 2015-2019 Financial Statement Data and Stock Price Data for Mydeco Corp. (All data as of fiscal year end; in $ millions) Income Statement 2015 2016 2017 2018 Revenue 394.5 364.3 425.7 506.7 Cost of Goods Sold (1877) (175.3) (202.0) (2456) Gross Profit 206.8 189.0 223.7 261.1 Sales and Marketing (66.6) (680) (83.7) (967) Administration (60.3) (60.8) (61.2) (67.6) Depreciation & Amortization (26.4) (27.2) (34.1) (371) EBIT 53.5 33.0 44.7 59.7 Interest Income (Expense) (35.1) (31.0) (33.8) (357) Pretax Income 18.4 2.0 10.9 24.0 Income Tax (6.4) (0.7 (3.8) (8.4) Net Income 1.3 7.1 15.6 Shares Outstanding (millions) 54.4 54.4 54.4 54.4 Earnings per Share $0.22 $0.02 $0.13 $0,29 Balance Sheet 2015 2016 2017 2018 Assets Cash 47.5 63,8 83.9 81.6 Accounts Receivable 87.3 69.3 70.4 76.1 Inventory 35.4 30.6 30.3 30.3 Total Current Assets 170.2 163.7 184.6 188.0 Net Property, Plant & Equipment 2472 241.7 310.1 344.4 Goodwill & Intangibles 362.6 362.6 362.6 362.6 Total Assets 780.0 768.0 8573 895.0 Liabilities & Stockholders' Equity Accounts Payable 18.3 16.8 23.5 25.1 Accrued Compensation 7.5 5.5 7.1 8.7 2019 606.8 (297.8) 309.0 (121.5) (792) (39.1) 69.2 (38.8) 30.4 (10.6) 19.8 54.4 $0.36 2019 12.0 84.5 84.6 372 206.3 347.7 362.6 916.6 30.6 10.2 47.5 87.3 35.4 170.2 247.2 362.6 780.0 63.8 69.3 30.6 163.7 241.7 362.6 768.0 83.9 70.4 30.3 184.6 310.1 362.6 857.3 81.6 76.1 30.3 188.0 344.4 362.6 895.0 84.5 84.6 37.2 206.3 347.7 362.6 916.6 Cash Accounts Receivable Inventory Total Current Assets Net Property, Plant & Equipment Goodwill & Intangibles Total Assets Liabilities & Stockholders' Equity Accounts Payable Accrued Compensation Total Current Liabilities Long-Term Debt Total Liabilities Stockholders' Equity Total Liabilities & Stockholders' Equity Statement of Cash Flows Net Income Depreciation & Amortization Change in Accounts Receivable Change in Inventory Change in Pay. & Accrued Comp. Cash from Operations Capital Expenditures Cash from Investing Activ Dividends Paid Sale (or Purchase) of Stock Debt Issuance (Pay Down) Cash from Financing Activ Change in Cash Mydeco Stock Price 18.3 7.5 25.8 499.2 525.0 255.0 780.0 2015 12.0 26.4 3.9 (3.0) 2.1 41.4 (23.9) (23.9) (5.3) 16.8 5.5 22.3 499.2 521.5 246.5 768.0 2016 1.3 27.2 18.0 4.8 (3.5) 47.8 (26.2) (26.2) (5.3) 23.5 7.1 30.6 574.6 605.2 252.1 857.3 2017 7.1 34.1 - 1.1 0.3 8.3 48.7 (98.7) (98.7) 25.1 8.7 33.8 601.1 634.9 260.1 895.0 2018 15.6 37.1 (5.7) 0.0 3.2 50.2 (73.7) (73.7) (5.3) 30.6 10.2 40.8 601.1 641.9 274.7 916.6 2019 19.8 39.1 (8.5) (6.9) 7.0 50.5 (41.4) (41.4) (6.2) (5.3) (5.3) 12.2 $8.25 (5.3) 16.3 $2.68 75.4 70.1 20.1 $6.17 26.5 21.2 (2.3) $7.77 (6.2) 2.9 $11.28
Step by Step Solution
There are 3 Steps involved in it

Get step-by-step solutions from verified subject matter experts