Question: Solve 7b and use this excel sheet and table from another Q b) Your client thinks that they are operating at a very high capacity
Solve 7b and use this excel sheet and table from another Q
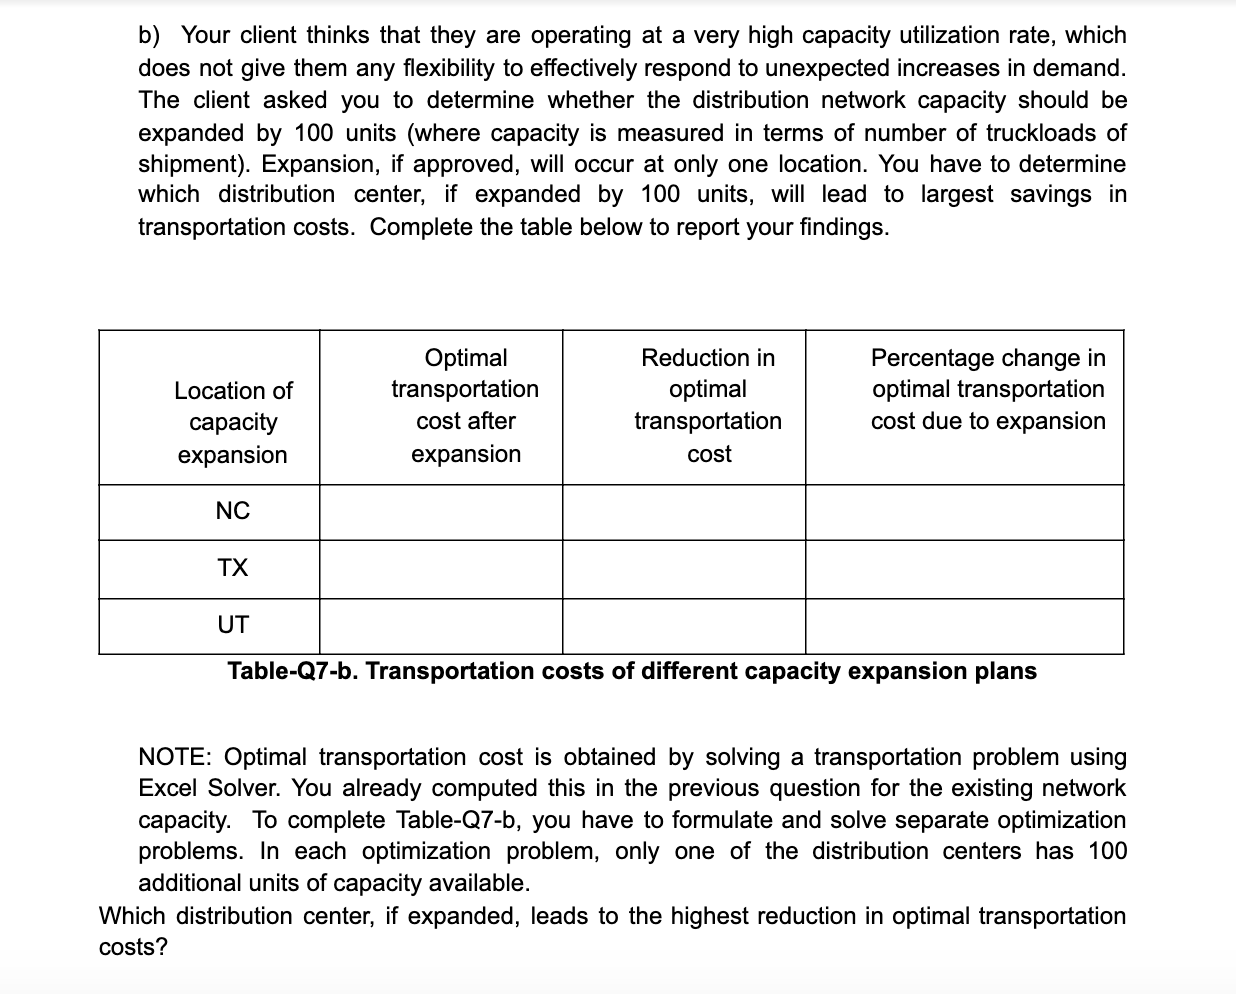
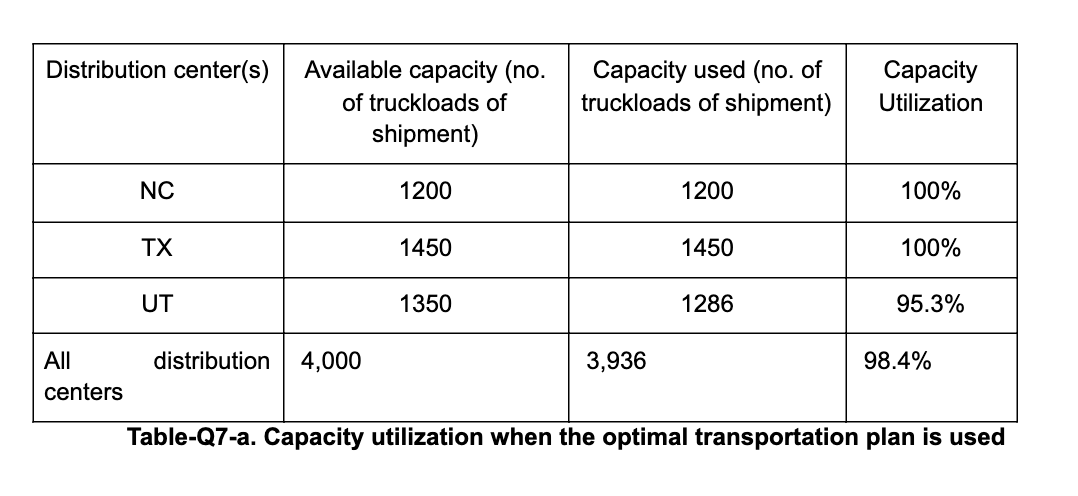
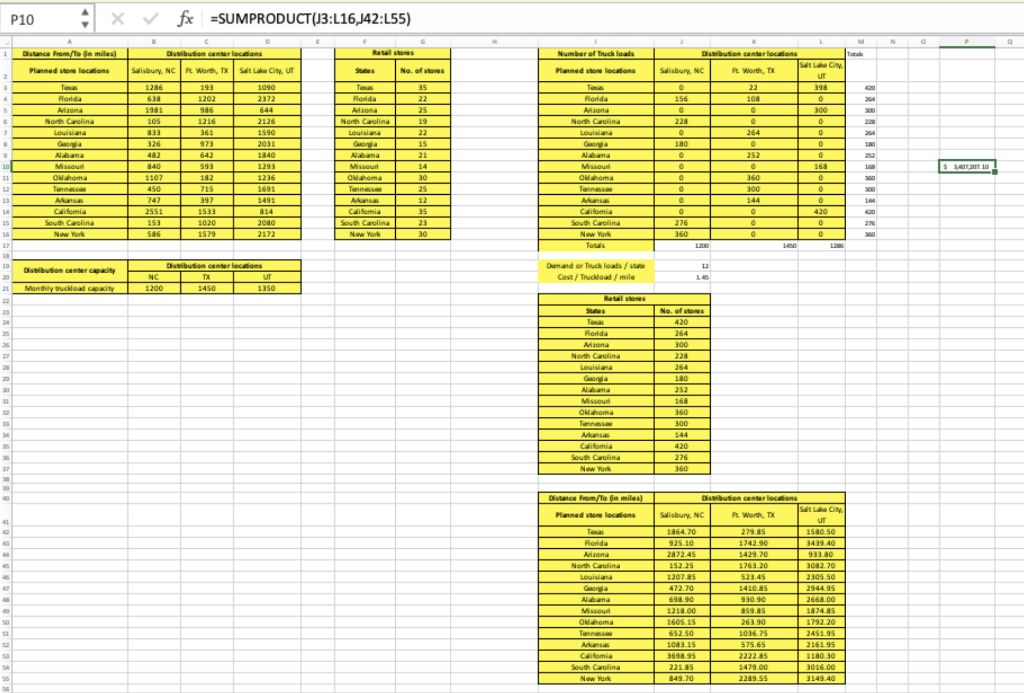
b) Your client thinks that they are operating at a very high capacity utilization rate, which does not give them any flexibility to effectively respond to unexpected increases in demand. The client asked you to determine whether the distribution network capacity should be expanded by 100 units (where capacity is measured in terms of number of truckloads of shipment). Expansion, if approved, will occur at only one location. You have to determine which distribution center, if expanded by 100 units, will lead to largest savings in transportation costs. Complete the table below to report your findings. Location of capacity expansion Optimal transportation cost after expansion Reduction in optimal transportation cost Percentage change in optimal transportation cost due to expansion NC TX UT Table-Q7-b. Transportation costs of different capacity expansion plans NOTE: Optimal transportation cost is obtained by solving a transportation problem using Excel Solver. You already computed this in the previous question for the existing network capacity. To complete Table-Q7-b, you have to formulate and solve separate optimization problems. In each optimization problem, only one of the distribution centers has 100 additional units of capacity available. Which distribution center, if expanded, leads to the highest reduction in optimal transportation costs? Distribution center(s) Available capacity (no. of truckloads of shipment) Capacity used (no. of truckloads of shipment) Capacity Utilization NC 1200 1200 100% TX 1450 1450 100% UT 1350 1286 95.3% distribution 4,000 3,936 98.4% All centers Table-Q7-a. Capacity utilization when the optimal transportation plan is used P10 X fx =SUMPRODUCT(13:L16,J42:155) M N 1 Distance from/le in miles) Retail stores ) Number of Truck loads Planned store locations Disbuden en locations Salisbury, NC Worth, TX Salt Lake City, UT 1286 1090 638 1202 2372 Sus 2 No. of ses Planned cons 0 . 4 5 Florida Arizona North Carolina Louisiana 105 1216 361 7 35 22 25 19 22 15 21 2126 1590 2031 1840 1293 1236 ZA To Florida Aviona North Carolina Louisiana Georgia Alabama Missouri Olahoma Tennes Distribution center locations Salt Salisbury, NC Rt Worth, TX UT 22 398 156 108 0 O 300 228 0 O 264 0 180 O 0 252 0 0 16 0 360 0 O 100 0 0 144 0 0 420 276 0 360 9 10 11 $ 2010 593 182 715 Team Rorida Aulona North Carolina Louisiana Gard Nama Missou Oklahoma Tannes Arkansas Califomia South Carolina New York Touls bana Missouri Olahoma Tennessee Arkansas California South Carolina New York 12 482 840 1107 450 747 2551 153 586 30 25 12 35 23 14 15 1533 1020 1579 814 2080 2172 Califomia South Carolina New York 276 17 140 19 20 Disebuton certy Distribution centreccions TA UT 1450 1350 Demand or Truckloads/ Cost/Truckload/mile NC 1200 21 Monthly load city 23 20 No. of shoes 420 Rorida Arizona North Carolina Louisiana Georgia Alabama Missouri Odhoma Tennessee Arkansas Califomia South Carolina New York 264 300 228 264 180 252 168 360 300 226 360 Distance from/to miles) Panned when locations Rorida Azona North Carolina Louisiana Georgia Alabama Missouri ONahoma Tanne Aansas Califomia South Carolina New York Distribution center locations Slisbury, NC Pt. Worth, TX UT 1864.70 279.85 1580 SO 925.10 1742.90 3439.40 2872.45 1429.70 933.80 152.25 1763.20 3082.70 1207.3 523.45 2305.50 472.70 1410.85 2944.95 698.90 930.90 2668 00 1218.00 859.85 1874 85 1605.15 263.90 1792.20 652.50 1036.75 2451.95 1083.15 575.65 2161.95 3698.95 2222.85 1180 30 2218 1479.00 3016.00 349.70 2289.55 3149.40 b) Your client thinks that they are operating at a very high capacity utilization rate, which does not give them any flexibility to effectively respond to unexpected increases in demand. The client asked you to determine whether the distribution network capacity should be expanded by 100 units (where capacity is measured in terms of number of truckloads of shipment). Expansion, if approved, will occur at only one location. You have to determine which distribution center, if expanded by 100 units, will lead to largest savings in transportation costs. Complete the table below to report your findings. Location of capacity expansion Optimal transportation cost after expansion Reduction in optimal transportation cost Percentage change in optimal transportation cost due to expansion NC TX UT Table-Q7-b. Transportation costs of different capacity expansion plans NOTE: Optimal transportation cost is obtained by solving a transportation problem using Excel Solver. You already computed this in the previous question for the existing network capacity. To complete Table-Q7-b, you have to formulate and solve separate optimization problems. In each optimization problem, only one of the distribution centers has 100 additional units of capacity available. Which distribution center, if expanded, leads to the highest reduction in optimal transportation costs? Distribution center(s) Available capacity (no. of truckloads of shipment) Capacity used (no. of truckloads of shipment) Capacity Utilization NC 1200 1200 100% TX 1450 1450 100% UT 1350 1286 95.3% distribution 4,000 3,936 98.4% All centers Table-Q7-a. Capacity utilization when the optimal transportation plan is used P10 X fx =SUMPRODUCT(13:L16,J42:155) M N 1 Distance from/le in miles) Retail stores ) Number of Truck loads Planned store locations Disbuden en locations Salisbury, NC Worth, TX Salt Lake City, UT 1286 1090 638 1202 2372 Sus 2 No. of ses Planned cons 0 . 4 5 Florida Arizona North Carolina Louisiana 105 1216 361 7 35 22 25 19 22 15 21 2126 1590 2031 1840 1293 1236 ZA To Florida Aviona North Carolina Louisiana Georgia Alabama Missouri Olahoma Tennes Distribution center locations Salt Salisbury, NC Rt Worth, TX UT 22 398 156 108 0 O 300 228 0 O 264 0 180 O 0 252 0 0 16 0 360 0 O 100 0 0 144 0 0 420 276 0 360 9 10 11 $ 2010 593 182 715 Team Rorida Aulona North Carolina Louisiana Gard Nama Missou Oklahoma Tannes Arkansas Califomia South Carolina New York Touls bana Missouri Olahoma Tennessee Arkansas California South Carolina New York 12 482 840 1107 450 747 2551 153 586 30 25 12 35 23 14 15 1533 1020 1579 814 2080 2172 Califomia South Carolina New York 276 17 140 19 20 Disebuton certy Distribution centreccions TA UT 1450 1350 Demand or Truckloads/ Cost/Truckload/mile NC 1200 21 Monthly load city 23 20 No. of shoes 420 Rorida Arizona North Carolina Louisiana Georgia Alabama Missouri Odhoma Tennessee Arkansas Califomia South Carolina New York 264 300 228 264 180 252 168 360 300 226 360 Distance from/to miles) Panned when locations Rorida Azona North Carolina Louisiana Georgia Alabama Missouri ONahoma Tanne Aansas Califomia South Carolina New York Distribution center locations Slisbury, NC Pt. Worth, TX UT 1864.70 279.85 1580 SO 925.10 1742.90 3439.40 2872.45 1429.70 933.80 152.25 1763.20 3082.70 1207.3 523.45 2305.50 472.70 1410.85 2944.95 698.90 930.90 2668 00 1218.00 859.85 1874 85 1605.15 263.90 1792.20 652.50 1036.75 2451.95 1083.15 575.65 2161.95 3698.95 2222.85 1180 30 2218 1479.00 3016.00 349.70 2289.55 3149.40


