

Question: Statistics: Regression Analsyis (use python!!!!) no not use R studio!!! Example 14: Let's investigate the iris dataset for the relationship between sepal length and width.
Statistics: Regression Analsyis (use python!!!!) no not use R studio!!!
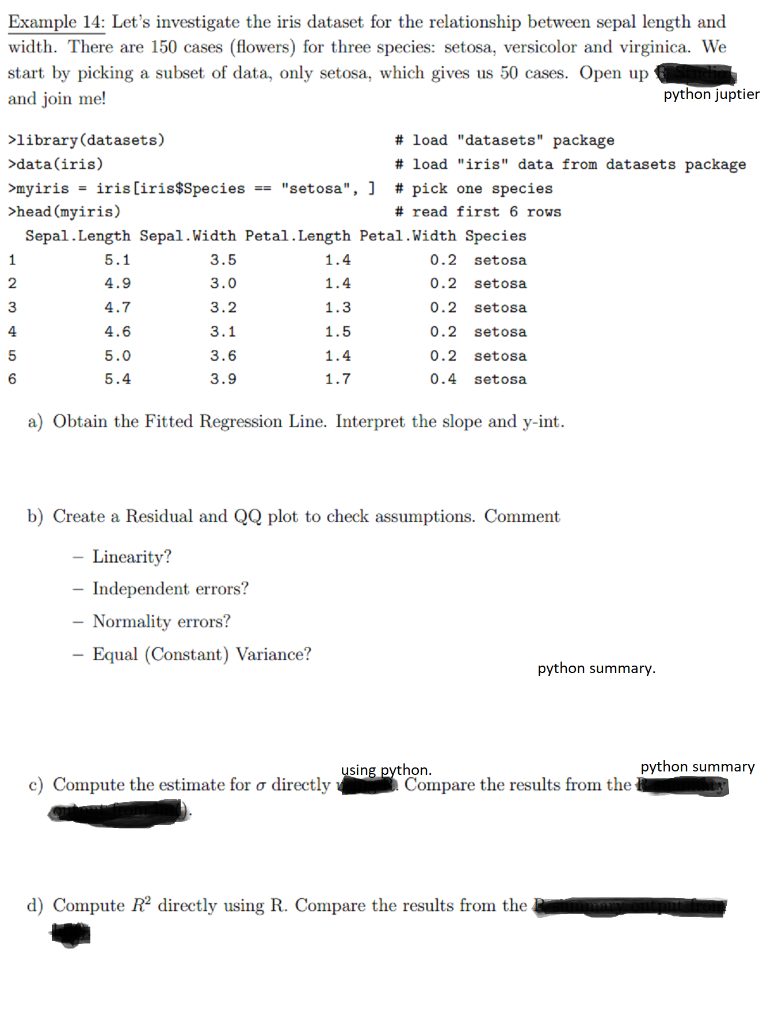
Example 14: Let's investigate the iris dataset for the relationship between sepal length and width. There are 150 cases (flowers) for three species: setosa, versicolor and virginica. We start by picking a subset of data, only setosa, which gives us 50 cases. Open up and join me! python juptier >library (datasets) # load "datasets" package >data (iris) # load "iris" data from datasets package >myiris = iris(iris$Species == "setosa", ] # pick one species >head (myiris) # read first 6 rows Sepal.Length Sepal.Width Petal.Length Petal. Width Species 1 5.1 3.5 1.4 0.2 setosa 2 4.9 3.0 1.4 0.2 setosa 3 4.7 3.2 1.3 0.2 setosa 4 4.6 3.1 1.5 0.2 setosa 5 5.0 3.6 1.4 0.2 setosa 6 5.4 3.9 1.7 0.4 setosa a) Obtain the Fitted Regression Line. Interpret the slope and y-int. b) Create a Residual and QQ plot to check assumptions. Comment Linearity? Independent errors? Normality errors? Equal (Constant) Variance? python summary. python summary using python. c) Compute the estimate for o directly Compare the results from the d) Compute R2 directly using R. Compare the results from the
Step by Step Solution
There are 3 Steps involved in it

Get step-by-step solutions from verified subject matter experts