

Question: Step 3: Sort and Create Summary Report and Chart To create the Sorted Data worksheet, begin by creating a copy of the Condo Sales Data.
Step 3: Sort and Create Summary Report and Chart
- To create the Sorted Data worksheet, begin by creating a copy of the Condo Sales Data. Once a copy has been made of the Condo Sales Data and moved to a new sheet, name the new worksheet Sorted Data. We will not need the Address column, so please delete that column of data from the Sorted Data worksheet.
- Convert the data in the Sorted Data worksheet into a table. Select the rectangular block of cells contained in the Sorted Data worksheet. Click the Insert tab and select Tables from the Tables group. Remember to check that your table has headers.
- Sort the data by selling agent and then by asking price. Once the data has been sorted, you can convert it back into a range. You must convert to range before you can provide a summary report.
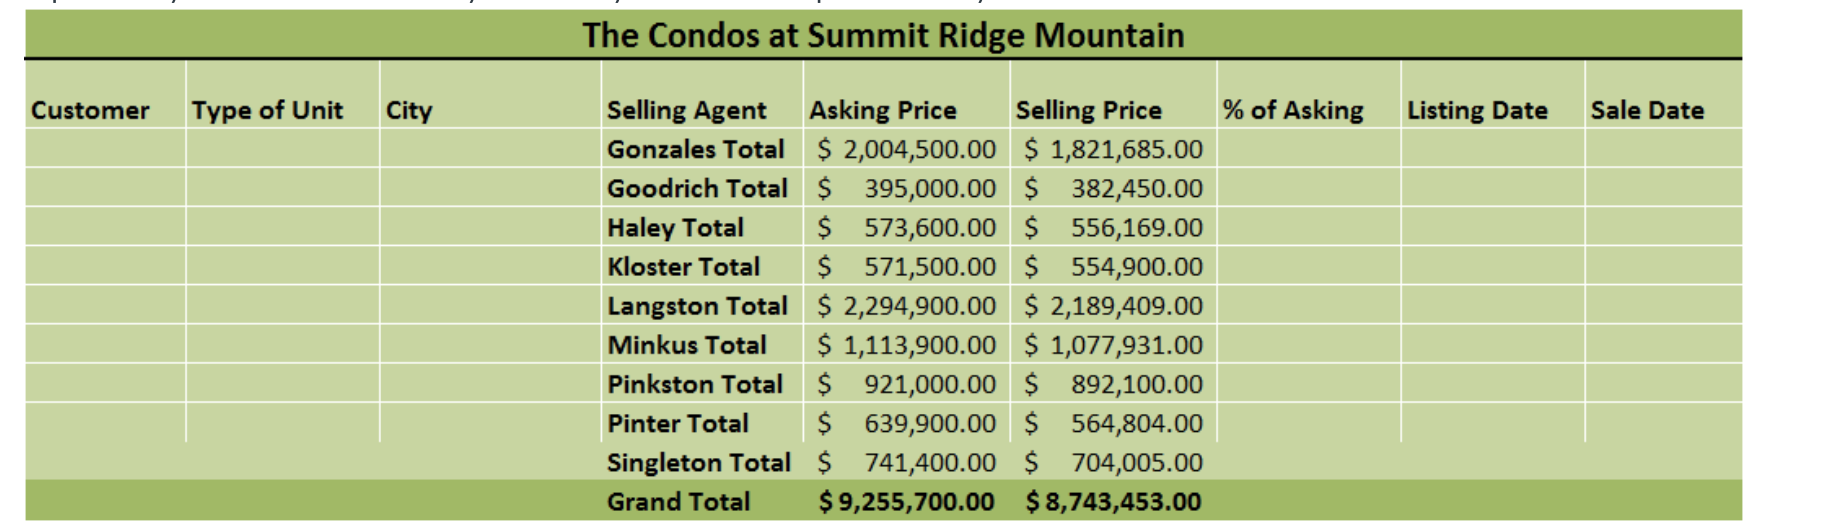
- Create a summary report showing total asking and total selling price by agent. Using subtotals, you will select the criteria for your subtotal. Each time the agent name changes, you want the total (sum) of both the Asking Price and Selling Price. Make sure the outline level of your subtotal is set to two on the left top area of your screen. Make sure you format your worksheet professionally.
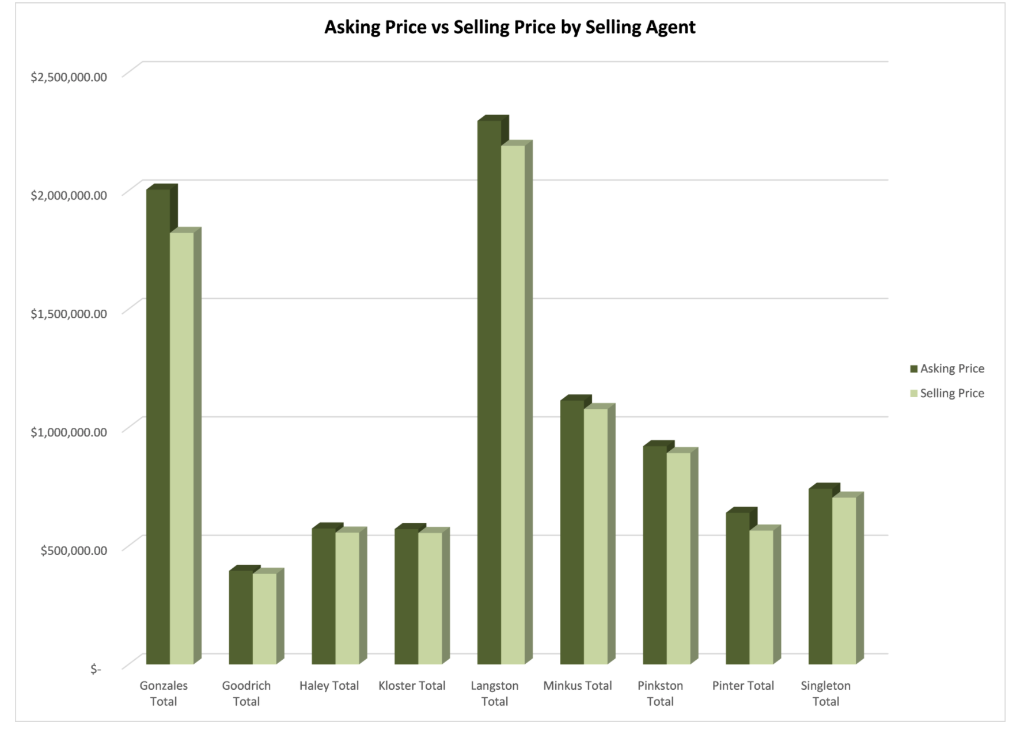
 5. Create a Column Chart to compare asking price versus selling price by agent. Make certain you provide a professional chart title and formatting for your chart. Include a legend to show what each color represents. Move this chart to a new worksheet and name it Ask vs. Sell Price Chart.
Step by Step Solution
There are 3 Steps involved in it
1 Expert Approved Answer
Step: 1 Unlock

Question Has Been Solved by an Expert!
Get step-by-step solutions from verified subject matter experts
Step: 2 Unlock
Step: 3 Unlock