

Question: Step Instructions 1 1 Start Excel. Download and open the workbook named: Brooks_Chapter_14_2_Start. N In cell D74, by using cell references, calculate the net profit
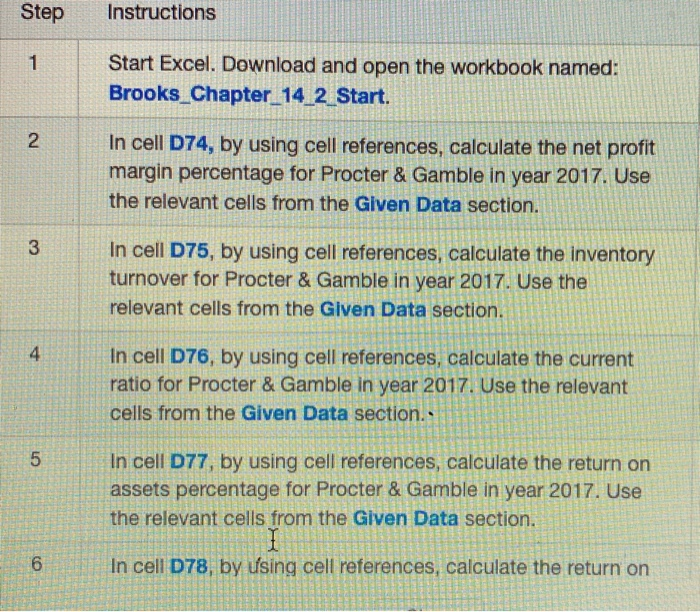
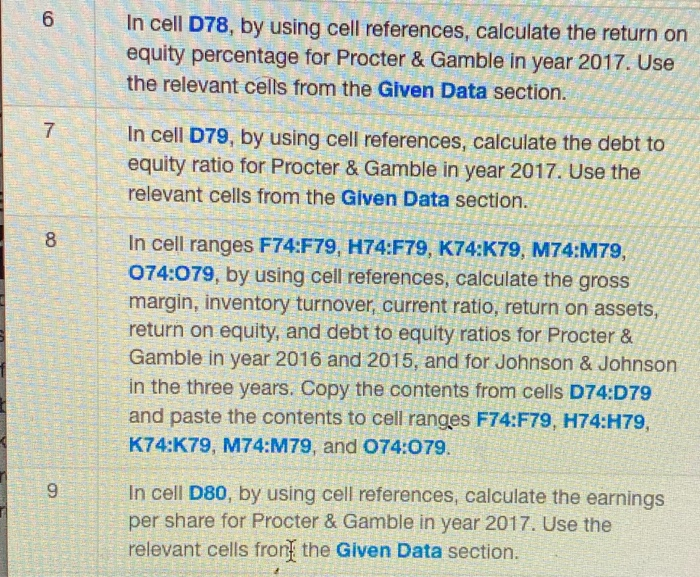
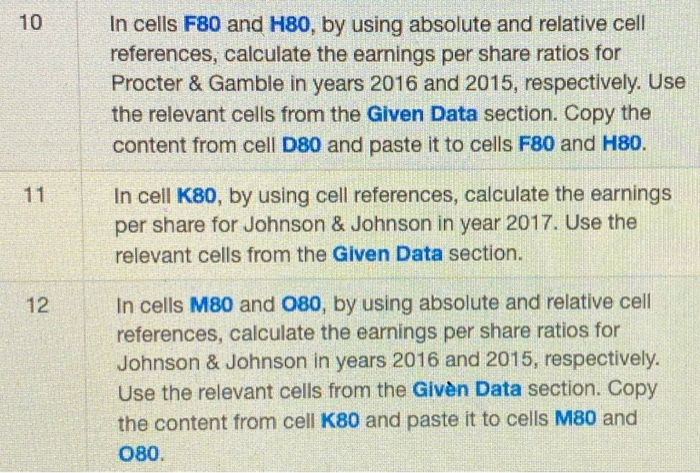
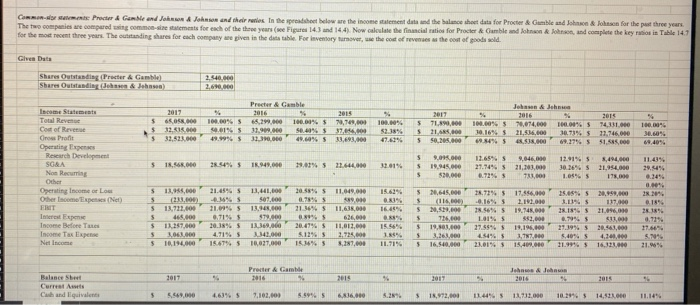
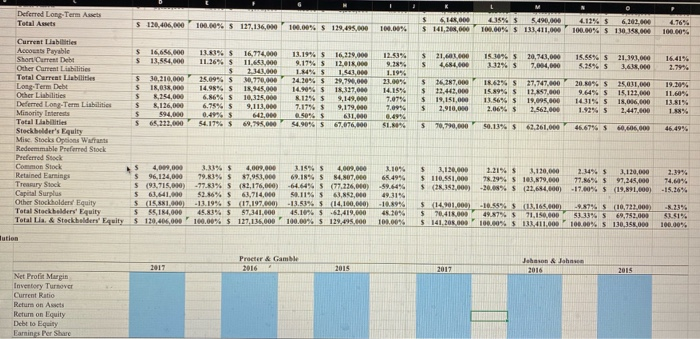
Step Instructions 1 1 Start Excel. Download and open the workbook named: Brooks_Chapter_14_2_Start. N In cell D74, by using cell references, calculate the net profit margin percentage for Procter & Gamble in year 2017. Use the relevant cells from the Given Data section. 3 In cell D75, by using cell references, calculate the inventory turnover for Procter & Gamble in year 2017. Use the relevant cells from the Given Data section. 4 In cell D76, by using cell references, calculate the current ratio for Procter & Gamble in year 2017. Use the relevant cells from the Given Data section." 5 In cell D77, by using cell references, calculate the return on assets percentage for Procter & Gamble in year 2017. Use the relevant cells from the Given Data section. I In cell D78, by using cell references, calculate the return on 6 6 In cell D78, by using cell references, calculate the return on equity percentage for Procter & Gamble in year 2017. Use the relevant cells from the Given Data section. 7 In cell D79, by using cell references, calculate the debt to equity ratio for Procter & Gamble in year 2017. Use the relevant cells from the Given Data section. Co In cell ranges F74:F79, H74:F79, K74:K79, M74:M79, 074:079, by using cell references, calculate the gross margin, inventory turnover, current ratio, return on assets, return on equity, and debt to equity ratios for Procter & Gamble in year 2016 and 2015, and for Johnson & Johnson in the three years. Copy the contents from cells D74:D79 and paste the contents to cell ranges F74:F79, H74:H79, K74:K79, M74:M79, and 074:079. 9 In cell D80, by using cell references, calculate the earnings per share for Procter & Gamble in year 2017. Use the relevant cells front the Given Data section. 10 In cells F80 and H80, by using absolute and relative cell references, calculate the earnings per share ratios for Procter & Gamble in years 2016 and 2015, respectively. Use the relevant cells from the Given Data section. Copy the content from cell D80 and paste it to cells F80 and H80. 11 In cell K80, by using cell references, calculate the earnings per share for Johnson & Johnson in year 2017. Use the relevant cells from the Given Data section. 12 In cells M80 and 080, by using absolute and relative cell references, calculate the earnings per share ratios for Johnson & Johnson in years 2016 and 2015, respectively. Use the relevant cells from the Given Data section. Copy the content from cell K80 and paste it to cells M80 and 080. CON Precer & Gamble and Johnson & Johnson and their reries in the spreadsheet below are the income statement date and the balance sheet data for Procter & Gamble and Johnson & Johnson for the past three years The two companies are compared wing common-statements for each of the three years (see Figure 14.3 and 144) Now calculate the financial notice for Procter & Gamble and Johnson and complete the key tosin Table 147 for the most recent three years. The outstanding shares for each company are given in the datatable For Inventory rever, we the cost of reverse the cost of goods sold Give Data Share Outstanding (Procter & Gamble) Shares Outstanding (Johnson & Johnson) 2.540.000 2,690.000 4 100.00% 5 2017 65.05.000 32.516 000 32,523,000 5 5 5 Procter & Gamble 2016 2015 100.01%. 70,709,000 31.900.000 50.40% 53746.000 32,390,000 49.60% 5 33,693,000 100.00% 5 5 5 2017 74.90,000 21.688,000 50,205,000 Johnson & John 2016 9 100.00% 37,074,000 100.00% 5 30,16% 21,536,000 30.73% 48. 18.000 69.27% 5 2015 74.131.00 23,746,000 49.99965 10.06 30.6096 69,40% 5 18,566,00 28.54% 5 IR 949,000 19.01% 5 22.614.000 32.01% Income Statements Total Revenue Cost of Revenue Cross Profit Operating Tees Research Development SG&A Nos Recurs Other Operating Income or Low Other compense (Net) FINT Ines Expo Income Before Totes Income Tax Exe Netice 5 5 s 9,095.00 19.945,000 $20.000 13.65% 9,046,00 27.74% 521,283,000 6.72% 733,000 12.91% 5 30.26% 1.05% 8,494,00 21.954,000 175.000 11.49% 20.94% 0.345 21.455 15.62% 25.05% s 5 5 5 12,945,000 (238.000 13.722.000 13,441,00 507.000 13.945,000 $19.000 13.369.000 16.46% 20.58% 11.049,010 0.75 21.36% 5 11,638,000 626,000 20.4195 11,012.000 51145 2.724,00 151645 3,187,000 5 5 5 5 5 $ 5 21.09% 5 0.71% 5 20.38% 5 4.7145 15.65 1,645,000 (115,000 2,529.000 735,00 19.163.000 3,263,000 16.540.000 26.7245 17.886,000 .6.16% 5 21.00 28.569 19.745.000 100% $ 882,000 27.55 19.195.000 4545 1.77.00 21.01% 15,409.000 28,959.000 117.00 21.09.09 $ 28 29 1896 26.38% 0.71 13.257.000 3.063.000 10,194,000 5 5 38.18% 5 6.795 21.1945 5.4065 11.99 15.56 185% 11.719 10,027.000 4,140,000 16,323.000 5.94 21.9% Procter & Game 2016 % " 2017 2015 John & Johns 2016 % 2017 Current Ass Chandquivalente 5.549.000 7,102,000 5.599 6,836.000 5 18,972,000 11.44% 13.732.000 10299 14,511.00 11.14 100.00% $ 6148,000 $ 141,200,000 415%$ 5.490.000 100.00% $ 133.411,000 4.11% $ 6,103,000 100.00 $ 130 14.000 100.00% $ 5 21,600.000 4,684.000 15.30% 5 32% 20,743,000 7,004,000 15.58% 5 2995 21,393,000 3.638,000 16.41% 2.7994 12.53% 9.28% 1.19% 23.00% 14.15% 7.07% 7.09% 0.49% $1.80% $ $ $ 5 16287,000 12.442.000 19,151,000 2,910,000 18.62% 15.89% 5 13.56% 5 2.06% $ 27,747.000 12.057.000 19.095.000 2.562.000 20.30 S 9.64% 5 1431% 5 1.92% 5 25,031,000 15.133,000 18,046,000 2.447.000 Deferred Long Term Assets Total Assets $ 120,406,00 100.00% 5 127,136,00 100.00% 5 129,495.000 Current Liabilities Accounts Payable s 16,656.000 16,774,000 13.19% $ 16,219.000 Short Current Debt $ 13.554,000 11.26% 11.653,000 9.17% 5 12.018.000 Other Current Liabilities $ 2.343,000 1.84% 5 1.543,000 Total Current Liability $ 30,210,000 25.09% S 20.770,000 24,20% 5 29.790,000 Long-Term Debt $ 18,038,000 14.98%S 18,945,000 14.90% 1837,000 Other Liabilities $ 8,254,000 10,325,000 8.11% 5 9,149,000 Deferred Long-Term Liabilities $ 8,126,000 6.7545 9,113,000 7.17% $ 9,179,000 Minority Interests s $94.000 0.49% 5 0.50% 631,000 Tatal Liabilities s 65.222.000 54.179 $ 69,795,000 54.90% 5 67,076,000 Stockbilder's Equity Misc. Stocks Options Warrants Redeemmable Preferred Stock Preferred Stock Common Stock $ 4,000,000 3.13% 5 4,009,000 3.15% 5 4,009,000 Retained Earning s 96, 124,000 79.83% 5 57,983.000 69.185 84,807,000 Treasury Stock 5 (93,715,000) -77.83% 5 (81,176,000) -64.64% 5 (77.226,010) Capital Surplus $ 63,641.000 52.86% 5 63,714,000 5.11% 63,852,000 Other Stockholders' Equity $(1581000) -13.19% $ 17.197.000) -13.53% (14,100,000) Total Stockholders' Equity $ $$1$4,000 45.83% 5 57,341.000 45.10% 3 61,419,000 Total Lia & Stockholders' Equity$ 120,406,000 100.00% $ 127,134.000 100.00% 5 129,495.000 lution 11.60% 13.81% 1.8% 5 70,790,000 50.13% 62.261,000 46.67% 60,606,000 46.49% 74.6% -15.26% 10% 65.49% -59.44% 49.31% -10.89% 45.18 100.00% 5 3,120,000 1.21% 3.120,000 2.34% 5 3.120,000 $ 110,551,000 78,29% 5 103,879,000 77.86% 5 97,245,000 $(28.150.000 -20.08% 5 (22,654,000) - 17.00% 3 (19,891,600) $14.901.000 -10.55% 5 (13.165.00 -9.87% S (10,722.000) 5 70.418.000 49.87963 71,150.000 53.33% S 69,752,000 $ 141,200.00 100.00% 5 131,411.000 100.00% 5 130,358.000 32 81% 100.00% 2017 Procter & Gamble 2016 2015 2017 Johnson & Johns 2016 2015 Net Hutt Mau Pin Invertory Turnover Current Ratio Return on Assets Return on Equity Debt to Equity Earnings Per Share
Step by Step Solution
There are 3 Steps involved in it

Get step-by-step solutions from verified subject matter experts