

Question: summary statistics. NATIONAL STATISTICS Column n Mean Std. dev. Min Q1 Median (13 Max median listing price 978 288,407 163,986 75,309 186,742 256,936 337,342 1,653,763
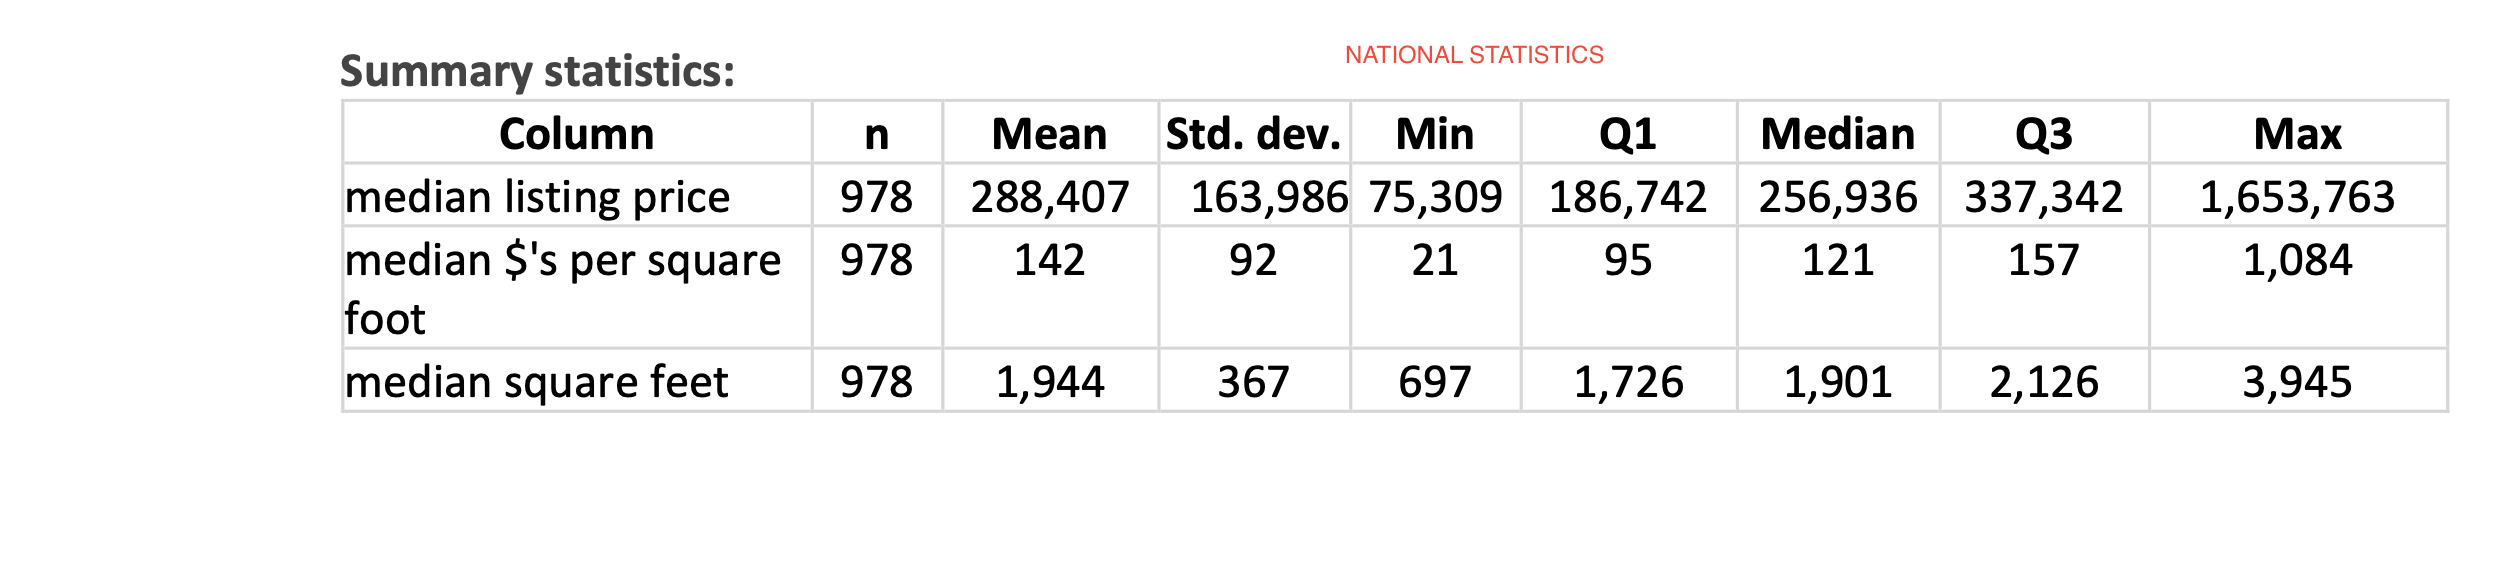
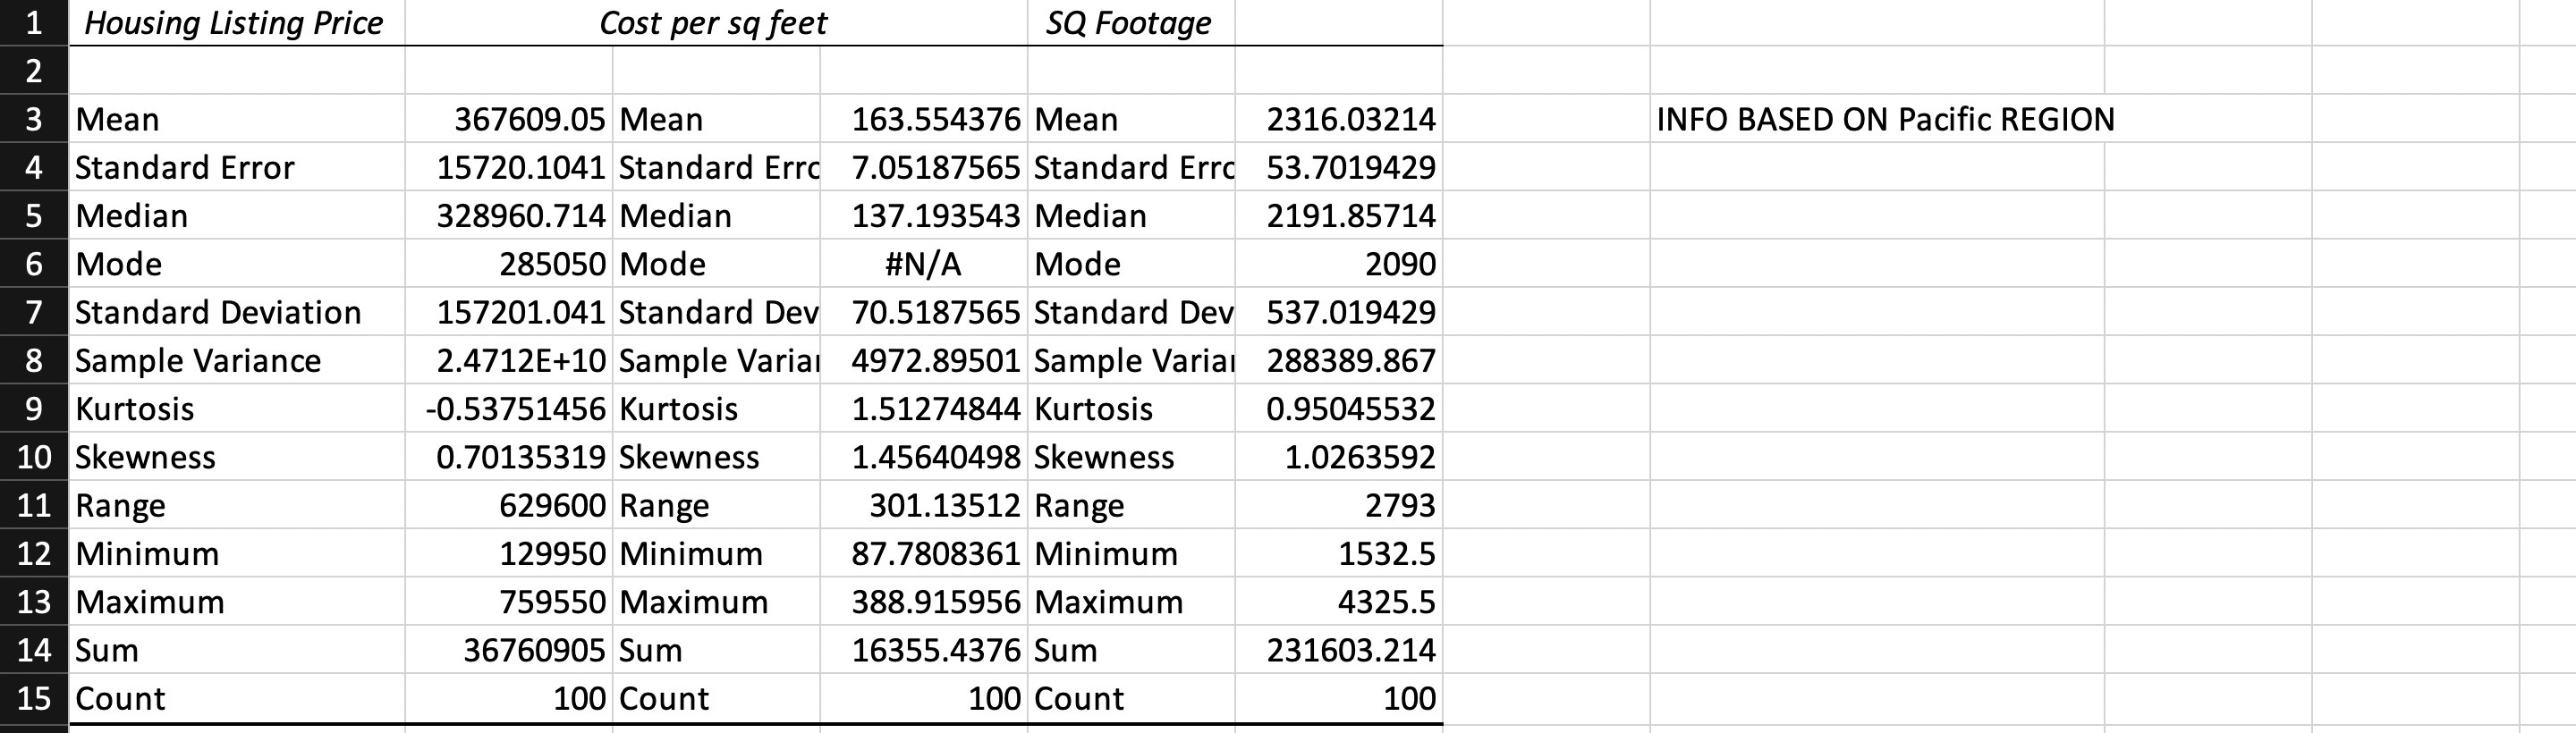
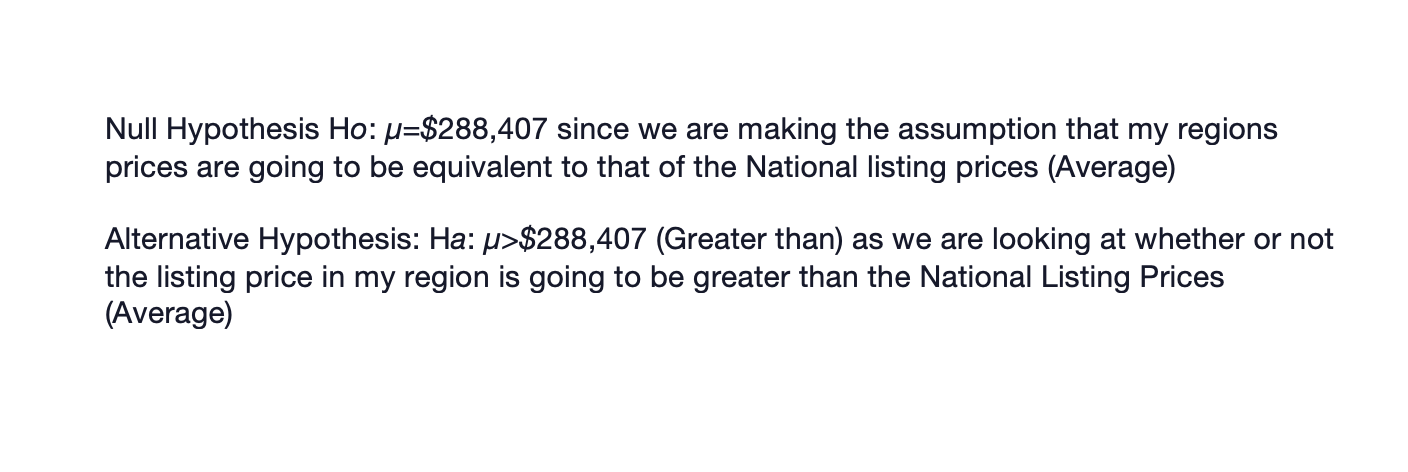
summary statistics. NATIONAL STATISTICS Column n Mean Std. dev. Min Q1 Median (13 Max median listing price 978 288,407 163,986 75,309 186,742 256,936 337,342 1,653,763 median S's per square 978 142 92 21 95 121 157 1,084 foot median square feet 978 1,944 367 697 1,726 1,901 2,126 3,945 Housing Listing Price Cost per sq feet SQ Footage N 3 Mean 367609.05 Mean 163.554376 Mean 2316.03214 INFO BASED ON Pacific REGION 4 Standard Error 15720.1041 Standard Erro 7.05187565 Standard Erro 53.7019429 5 Median 328960.714 Median 137.193543 Median 2191.85714 6 Mode 285050 Mode #N/A Mode 2090 Standard Deviation 157201.041 Standard Dev 70.5187565 Standard Dev 537.019429 8 Sample Variance 2.4712E+10 Sample Varial 4972.89501 Sample Varial 288389.867 9 Kurtosis -0.53751456 Kurtosis 1.51274844 Kurtosis 0.95045532 10 Skewness 0.70135319 Skewness 1.45640498 Skewness 1.0263592 11 Range 629600 Range 301.13512 Range 2793 12 Minimum 129950 Minimum 87.7808361 Minimum 1532.5 13 Maximum 759550 Maximum 388.915956 Maximum 4325.5 Sum 36760905 Sum 16355.4376 Sum 231603.214 15 Count 100 Count 100 Count 100Null Hypothesis Ho: p=$288,407 since we are making the assumption that my regions prices are going to be equivalent to that of the National listing prices (Average) Alternative Hypothesis: Ha: p>$288,407 (Greater than) as we are looking at whether or not the listing price in my region is going to be greater than the National Listing Prices (Average)
Step by Step Solution
There are 3 Steps involved in it

Get step-by-step solutions from verified subject matter experts