

Question: Suppose that f is the function given by the graph below and that a and ath are the input values as labeled on the
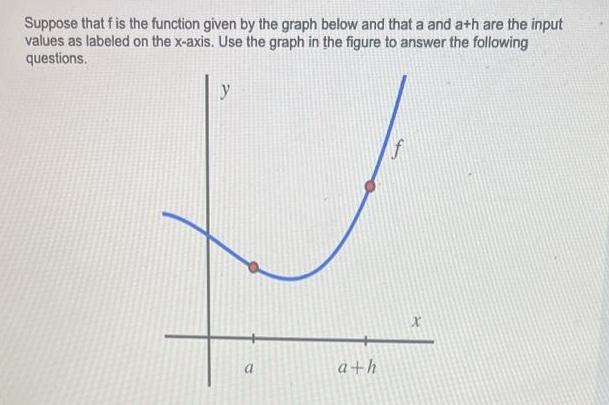

Suppose that f is the function given by the graph below and that a and ath are the input values as labeled on the x-axis. Use the graph in the figure to answer the following questions. y a a+h f X a. Locate and label the points (a, f(a)) and (a+h, f(a+h)) on the graph. b. Construct a right triangle whose hypotenuse is the line segment from (a, f(a)) to (a+h, f(a+h)). What are the lengths of the respective legs of this triangle? Length of horizontal leg = Length of vertical leg = c. What is the slope of the line that connects the points (a, f(a)) and (a+h, f(a+h))? Slope of line connecting these points = (ans) d. Write a meaningful sentence that explains how the average rate of change of the function on a given interval and the slope of a related line are connected.
Step by Step Solution
There are 3 Steps involved in it

Get step-by-step solutions from verified subject matter experts