

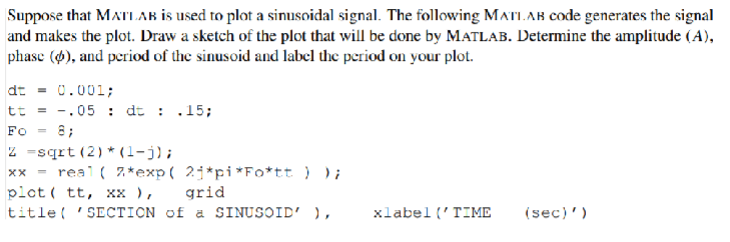
Question: Suppose that MAtI Ab is used to plot a sinusoidal signal. The following MATI.Ab code generates the signal and makes the plot. Draw a sketch
Suppose that MAtI Ab is used to plot a sinusoidal signal. The following MATI.Ab code generates the signal and makes the plot. Draw a sketch of the plot that will be done by Matlab. Determine the amplitude A phase phi and period of the sinusoid and label the period on your plot.
dt ;
tt : dt : ;
FO ;
Z sqrtj;
xx realexpjpiFott ;
plot tt xx grid
title 'SECTION of a SINUSOID' xlabelTIME sec
Step by Step Solution
There are 3 Steps involved in it
1 Expert Approved Answer
Step: 1 Unlock

Question Has Been Solved by an Expert!
Get step-by-step solutions from verified subject matter experts
Step: 2 Unlock
Step: 3 Unlock