

Question: Suppose that MATLAB is used to plot a sinusoidal signal. The following MATLAB code generates the signal and makes the plot. a ) Derive a
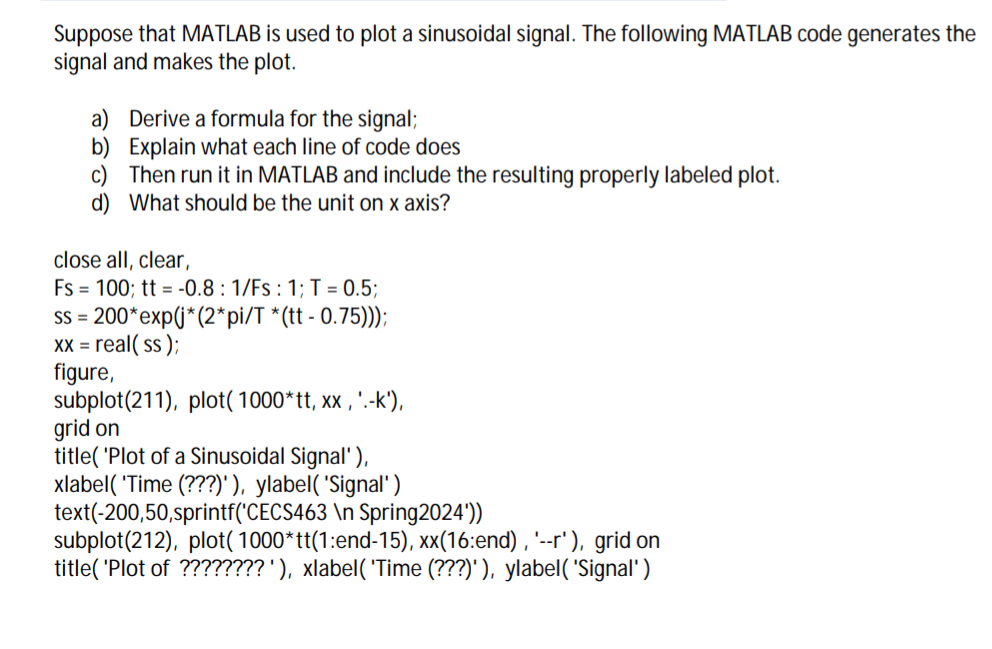
Suppose that MATLAB is used to plot a sinusoidal signal. The following MATLAB code generates the signal and makes the plot.
a Derive a formula for the signal;
b Explain what each line of code does
c Then run it in MATLAB and include the resulting properly labeled plot.
d What should be the unit on axis?
close all, clear,
;::;
exp;
real;
figure,
subplot plottt:end xx:endr grid on
title 'Plot of xlabel 'Time ylabel 'Signal'
Step by Step Solution
There are 3 Steps involved in it
1 Expert Approved Answer
Step: 1 Unlock

Question Has Been Solved by an Expert!
Get step-by-step solutions from verified subject matter experts
Step: 2 Unlock
Step: 3 Unlock