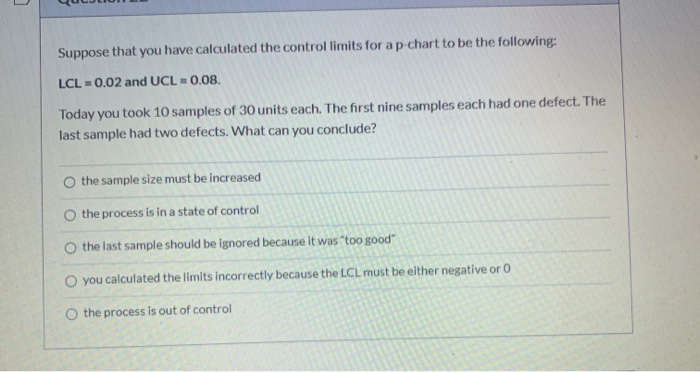
Question: Suppose that you have calculated the control limits for a p-chart to be the following: LCL = 0.02 and UCL = 0.08. Today you took

Suppose that you have calculated the control
Suppose that you have calculated the control limits for a p-chart to be the following: LCL = 0.02 and UCL = 0.08. Today you took 10 samples of 30 units each. The first nine samples each had one defect. The last sample had two defects. What can you conclude? the sample size must be increased the process is in a state of control O the last sample should be ignored because it was too good" O you calculated the limits incorrectly because the LCL must be either negative or 0 O the process is out of control

Step by Step Solution

There are 3 Steps involved in it

1 Expert Approved Answer
Step: 1 Unlock

Given Control limits for a pchart LCL Lower Control Limit 002 UCL Upper Control Limit 008 Sample siz... View full answer

blur-text-image
Question Has Been Solved by an Expert!

Get step-by-step solutions from verified subject matter experts

Step: 2 Unlock
Step: 3 Unlock

Students Have Also Explored These Related General Management Questions!