

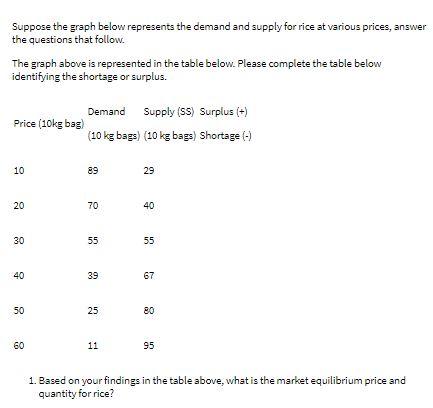
Question: Suppose the graph below represents the demand and supply for rice at various prices, answer the questions that follow. The graph above is represented in
Step by Step Solution
There are 3 Steps involved in it
1 Expert Approved Answer
Step: 1 Unlock

Question Has Been Solved by an Expert!
Get step-by-step solutions from verified subject matter experts
Step: 2 Unlock
Step: 3 Unlock