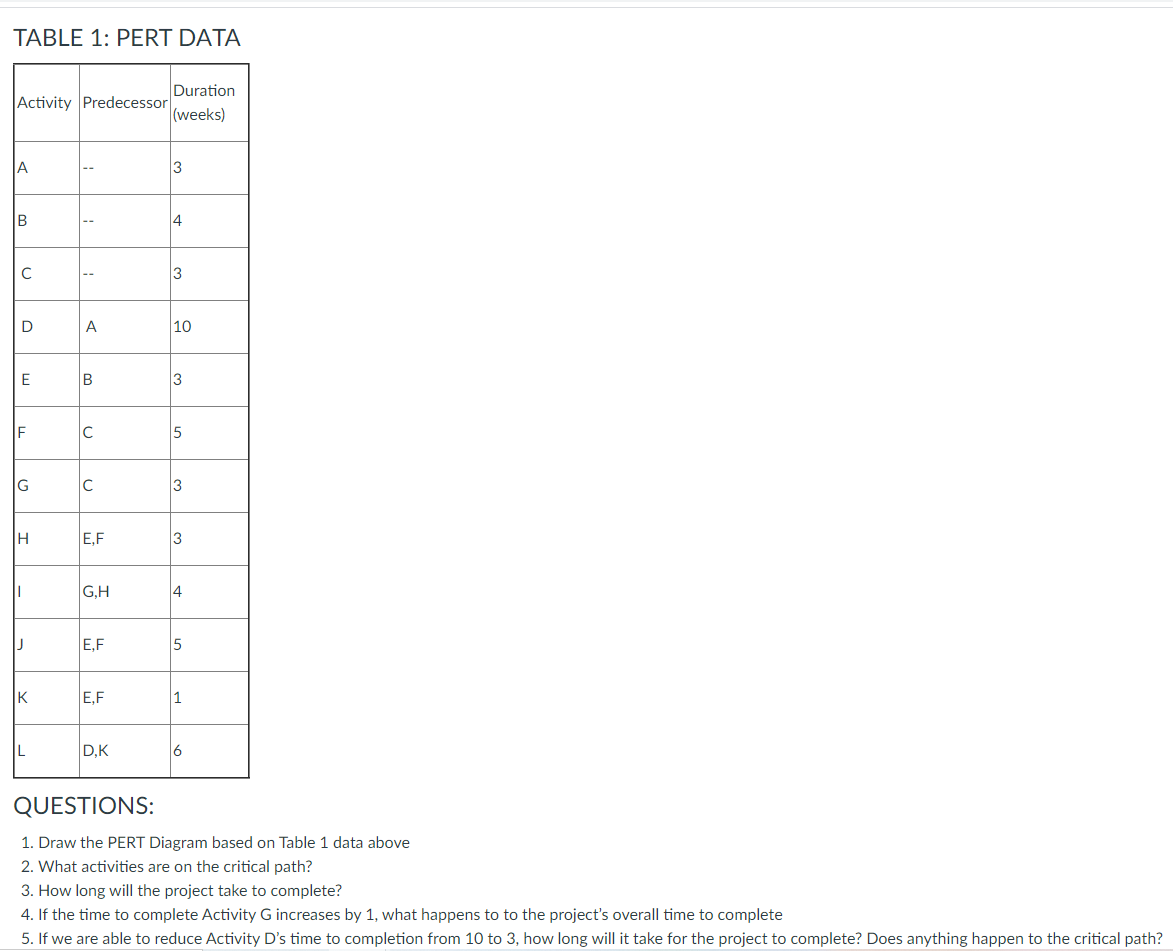
Question: TABLE 1: PERT DATA Duration Activity Predecessor (weeks) A 3 4 3 D A 10 E B 3 F C 5 IC 3 OI E,F

TABLE 1: PERT DATA Duration Activity Predecessor

TABLE 1: PERT DATA Duration Activity Predecessor (weeks) A 3 4 3 D A 10 E B 3 F C 5 IC 3 OI E,F 3 I GH 4 J E,F 5 IK E,F 1 L DK 6 QUESTIONS: 1. Draw the PERT Diagram based on Table 1 data above 2. What activities are on the critical path? 3. How long will the project take to complete? 4. If the time to complete Activity G increases by 1, what happens to to the project's overall time to complete 5. If we are able to reduce Activity D's time to completion from 10 to 3, how long will it take for the project to complete? Does anything happen to the critical path

Step by Step Solution

There are 3 Steps involved in it

1 Expert Approved Answer
Step: 1 Unlock blur-text-image
Question Has Been Solved by an Expert!

Get step-by-step solutions from verified subject matter experts

Step: 2 Unlock
Step: 3 Unlock

Students Have Also Explored These Related General Management Questions!