

Question: problem 3 of chapter 10 frame table 10.3 what will be the factor for x bar chart A2 problem 3 chapter 10 frame table 10.3
problem 3 of chapter 10 frame table 10.3 what will be the factor for x bar chart A2
problem 3 chapter 10 frame table 10.3 what will be the factor for x bar chart A2 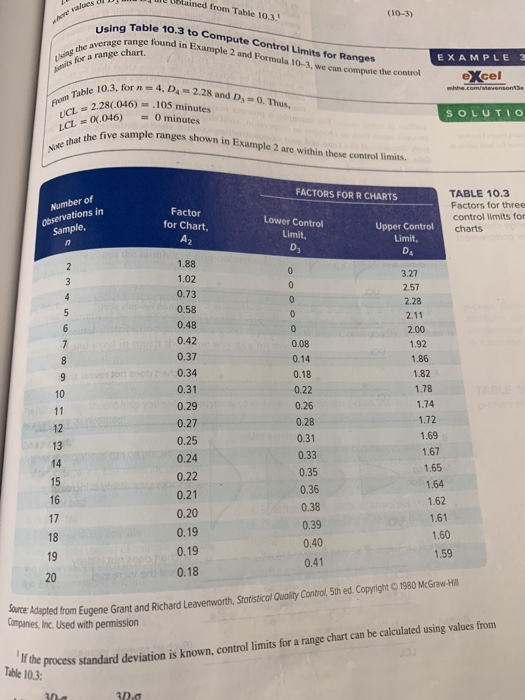
de Ublained from Table 10.3.1 e values (10-3) Using Table 10 ng Table 10.3 to Compute Control Limits for Ranges e range found in Example 2 and Formula 10-3 put the con ing the average is for a range chart. EXAMPLE 3 excel m e.comstevensonte 10.3. for n = 4.D 2.28 and D,-0. Thus From Table 10.1 2.280.046) = .105 minutes UCL = 2.286.040 SOLUTIO 04.046) = 0 minutes five sample ranges shown in Example 2 are within these controllimit Note that the five FACTORS FOR R CHARTS Number of Observations in Sample, Factor for Chart TABLE 10.3 Factors for three control limits for charts Lower Control Limit, D Upper Control Limit, 3.27 2.57 0.08 1.88 1.02 0.73 0.58 0.48 0.42 0.37 0.34 0.31 0.29 0.27 0.25 0.24 0.22 0.21 2.28 2.11 2.00 1.92 1.86 1.82 1.78 om 1.74 0.14 0.18 0.22 0.26 0.28 0.31 0.33 0.35 0.36 0.38 0.39 0.40 0.41 1.72 1.69 1.67 1.65 1.64 1.62 1.61 1.60 1.59 0.20 0.19 0.19 0.18 Adapted from Eugene Grant and Richard Leavenworth, Statistical Ouality Control, 5th ed. Copyright 1980 McGraw-Hill Companies, Inc. Used with permission If the process stand Table 10.3: process standard deviation is known, control limits for a range chart can be calculated using values from . 3 31.0
Step by Step Solution
There are 3 Steps involved in it
1 Expert Approved Answer
Step: 1 Unlock

Question Has Been Solved by an Expert!
Get step-by-step solutions from verified subject matter experts
Step: 2 Unlock
Step: 3 Unlock