

Question: Table 2. Standard curve absorbance data Table 2. Standard curve ahenrhanno dats Table view List view (4pts) Using the concentration and absorbance measurements in Table
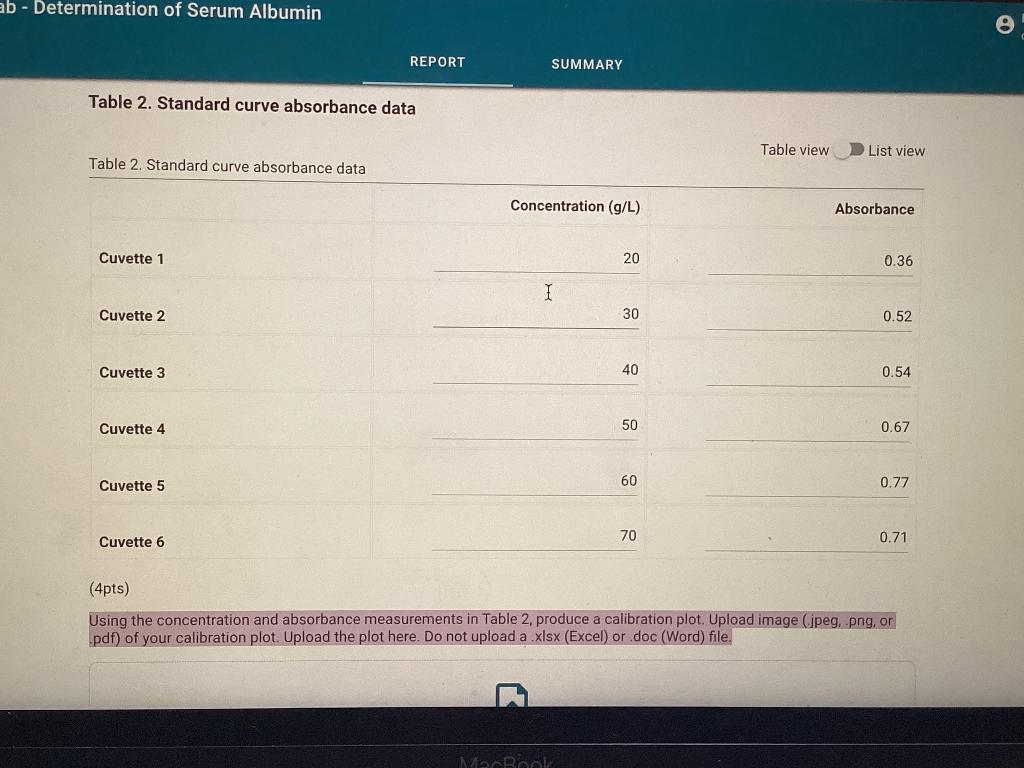
Table 2. Standard curve absorbance data Table 2. Standard curve ahenrhanno dats Table view List view (4pts) Using the concentration and absorbance measurements in Table 2, produce a calibration plot. Upload image (.jpeg, .png, or .pdf) of your calibration plot. Upload the plot here. Do not upload a xisx (Excel) or doc (Word) file
Step by Step Solution
There are 3 Steps involved in it
1 Expert Approved Answer
Step: 1 Unlock

Question Has Been Solved by an Expert!
Get step-by-step solutions from verified subject matter experts
Step: 2 Unlock
Step: 3 Unlock