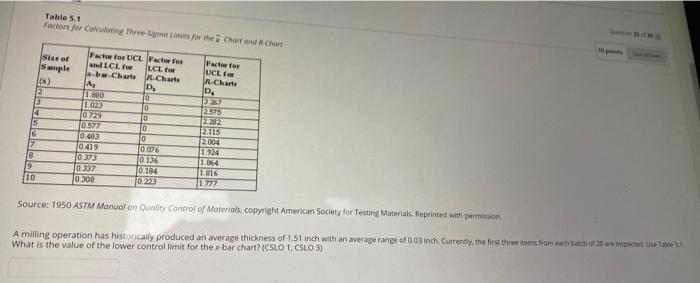
Question: Table 5.1 Factor for Coloring Three Somo Limits for the Chart and Chart Size of Sample 10) 2 2 4 15 6 7 @ 9

Table 5.1 Factor for Coloring Three Somo Limits
Table 5.1 Factor for Coloring Three Somo Limits for the Chart and Chart Size of Sample 10) 2 2 4 15 6 7 @ 9 10 Factor for UCL Factor for LCL Ich to bu Chart R Charts A. D 1.000 10 1.023 0 0.729 10 f0572 10 10403 10 10:43 0676 10373 0 136 10.337 0.784 10.300 0.223 Factate UCL R Chute D 33 2575 2282 2115 2004 1924 1.864 1.816 2777 Source: 1950 ASTM Moncalon Quality Control of Materials, copyright American Society for Testing Materials. Reprinted with permission A milling operation has historically produced an average thickness of 1.51 inch with an average range of 0.03 inch Currently, the first three items from each of 20 rectedUse Tale What is the value of the lower controllimit for the x-bar chart? (CSLO 1, CSLO 3)

Step by Step Solution

There are 3 Steps involved in it

1 Expert Approved Answer
Step: 1 Unlock blur-text-image
Question Has Been Solved by an Expert!

Get step-by-step solutions from verified subject matter experts

Step: 2 Unlock
Step: 3 Unlock

Students Have Also Explored These Related General Management Questions!