

Question: TABLE A2.5 Blue Zuma Project ID Task Name Duration Predecessors Resources Product development project Market analysis 25 days Marketing (4) Product design 40 days Marketing
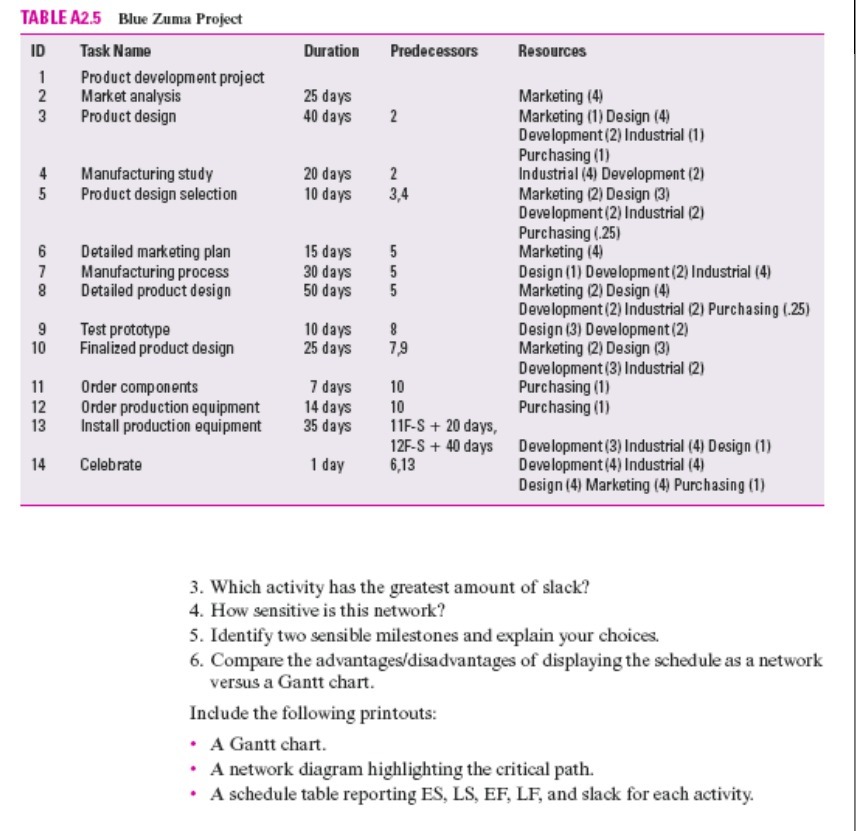
TABLE A2.5 Blue Zuma Project ID Task Name Duration Predecessors Resources Product development project Market analysis 25 days Marketing (4) Product design 40 days Marketing (1) Design (4) Development (2) Industrial (1) Purchasing (1) Manufacturing study 20 days Industrial (4) Development (2) Product design selection 10 days 3.4 Marketing (2) Design (3) Development (2) Industrial (2) Purchasing (.25) Detailed marketing plan 15 days Marketing (4) Manufacturing process 30 days Design (1) Development (2) Industrial (4) Detailed product design 50 days Marketing (2) Design (4) Development (2) Industrial (2) Purchasing (.25) Test prototype 10 days 8 Design (3) Development (2) 10 Finalized product design 25 days 79 Marketing (2) Design (3) Development (3) Industrial (2) 11 Order components 7 days 10 Purchasing (1) 12 Order production equipment 14 days 10 Purchasing (1) 13 Install production equipment 35 days 11F-S + 20 days, 12F-S + 40 days Development (3) Industrial (4) Design (1) 14 Celebrate 1 day 6,13 Development (4) Industrial (4) Design (4) Marketing (4) Purchasing (1) 3. Which activity has the greatest amount of slack? 4. How sensitive is this network? 5. Identify two sensible milestones and explain your choices. 6. Compare the advantages/disadvantages of displaying the schedule as a network versus a Gantt chart. Include the following printouts: . A Gantt chart. . A network diagram highlighting the critical path. . A schedule table reporting ES, LS, EF, LF, and slack for each activity
Step by Step Solution
There are 3 Steps involved in it

Get step-by-step solutions from verified subject matter experts