

Question: Task 2-1) Create a box plot that is comparing different stations total delay for departure. To do this, first filter column G (ArriDep) by selecting
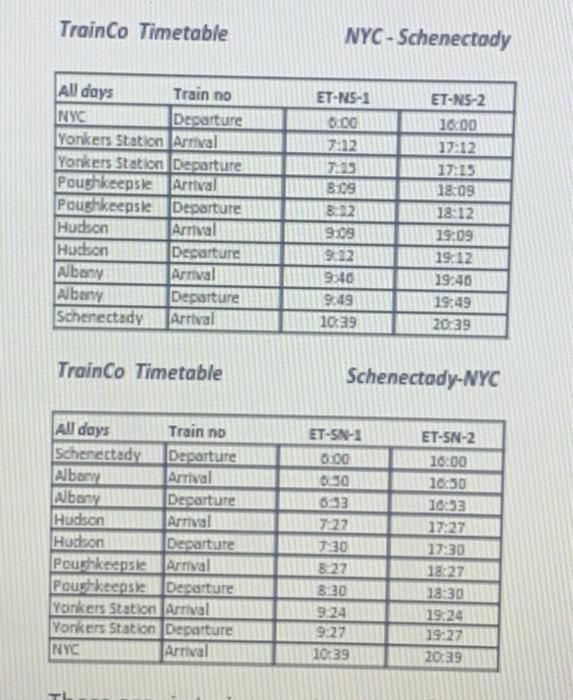
Task 2-1) Create a box plot that is comparing different stations "total delay" for departure. To do this, first filter column G (ArriDep) by selecting only "Departure". Copy the chart here. To copy a chart from Excel to Word, make sure you paste a picture of the chart. Explain what you understand about the chart. 13 Task 2-2) Create a box plot that is comparing different stations "Added Time" for departure. To do this, first filter column G (ArriDep) by selecting only "Departure". Copy the chart here. To copy a chart from Excel to Word, make sure you paste a picture of the chart. Explain what you understand about the chart. TrainCo Timetable NYC-Schenectady Trainco Timetable Schenectody-NYC Task 2-1) Create a box plot that is comparing different stations "total delay" for departure. To do this, first filter column G (ArriDep) by selecting only "Departure". Copy the chart here. To copy a chart from Excel to Word, make sure you paste a picture of the chart. Explain what you understand about the chart. 13 Task 2-2) Create a box plot that is comparing different stations "Added Time" for departure. To do this, first filter column G (ArriDep) by selecting only "Departure". Copy the chart here. To copy a chart from Excel to Word, make sure you paste a picture of the chart. Explain what you understand about the chart. TrainCo Timetable NYC-Schenectady Trainco Timetable Schenectody-NYC
Step by Step Solution
There are 3 Steps involved in it

Get step-by-step solutions from verified subject matter experts