

Question: Task 4: L04 In this task your supervisor has asked you to demonstrate and prove your understanding and ability to use the appropriate charts and
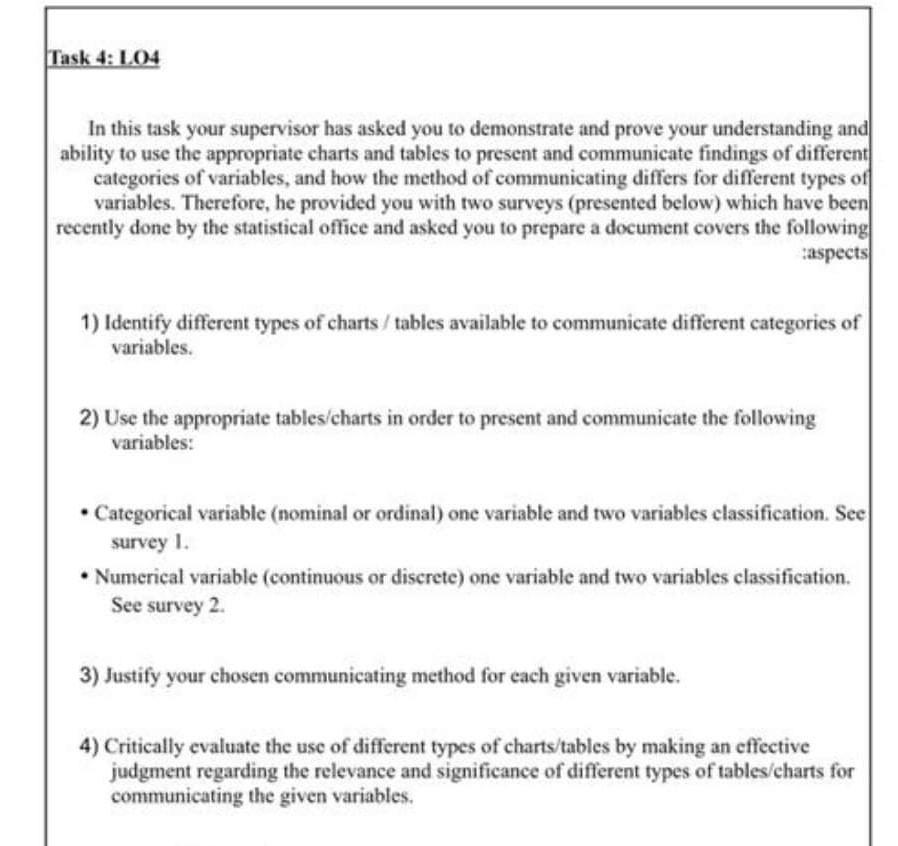
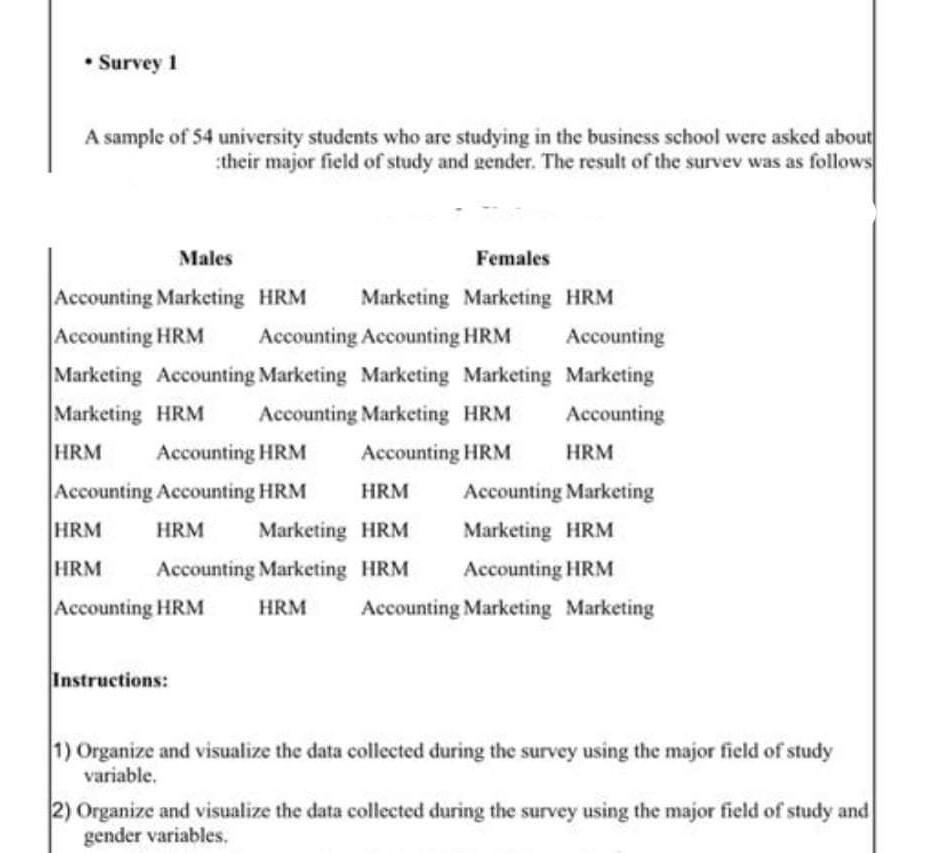
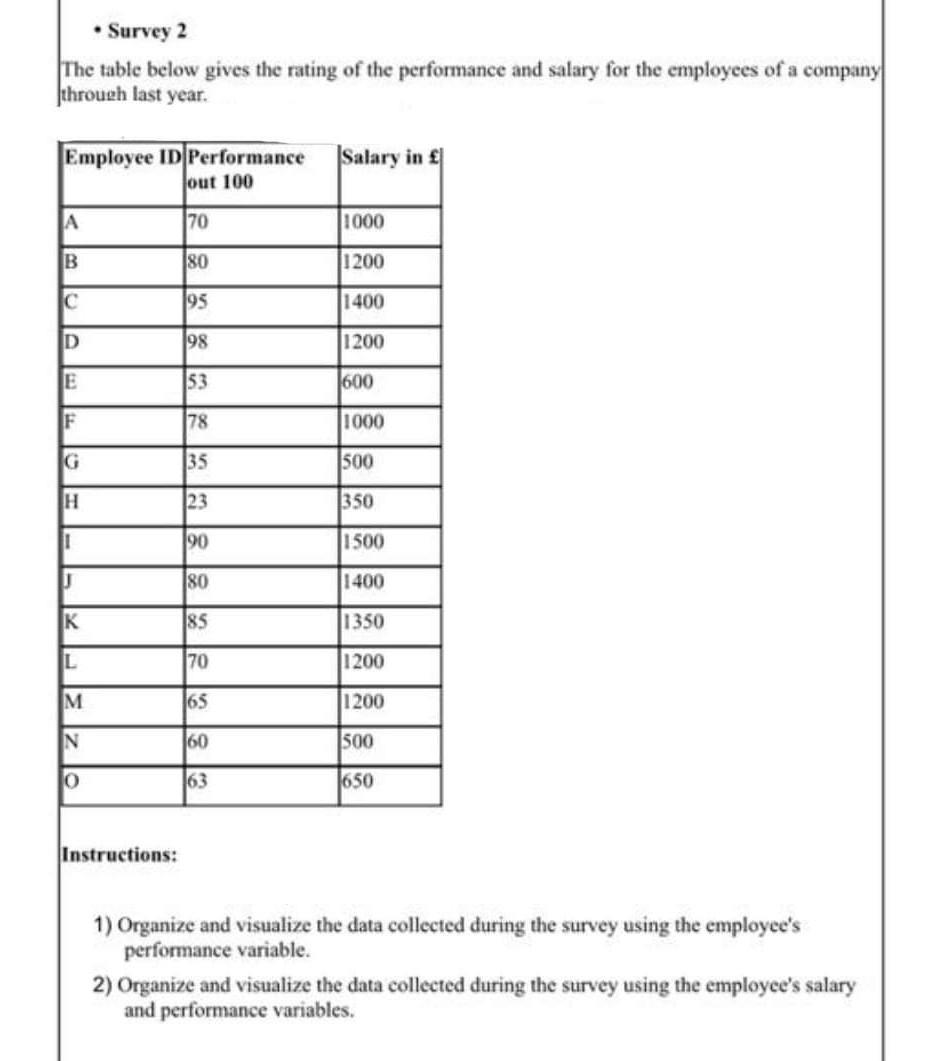
Task 4: L04 In this task your supervisor has asked you to demonstrate and prove your understanding and ability to use the appropriate charts and tables to present and communicate findings of different categories of variables, and how the method of communicating differs for different types of variables. Therefore, he provided you with two surveys (presented below) which have been recently done by the statistical office and asked you to prepare a document covers the following aspects 1) Identify different types of charts / tables available to communicate different categories of variables. 2) Use the appropriate tables/charts in order to present and communicate the following variables: Categorical variable (nominal or ordinal) one variable and two variables classification. See survey I. Numerical variable (continuous or discrete) one variable and two variables classification. See survey 2. 3) Justify your chosen communicating method for each given variable. 4) Critically evaluate the use of different types of charts/tables by making an effective judgment regarding the relevance and significance of different types of tables/charts for communicating the given variables. Survey 1 A sample of 54 university students who are studying in the business school were asked about their major field of study and gender. The result of the survey was as follows Males Females Accounting Marketing HRM Marketing Marketing HRM Accounting HRM Accounting Accounting HRM Accounting Marketing Accounting Marketing Marketing Marketing Marketing Marketing HRM Accounting Marketing HRM Accounting HRM Accounting HRM Accounting HRM HRM Accounting Accounting HRM HRM Accounting Marketing HRM HRM Marketing HRM Marketing HRM HRM Accounting Marketing HRM Accounting HRM Accounting HRM HRM Accounting Marketing Marketing Instructions: 1) Organize and visualize the data collected during the survey using the major field of study variable. 2) Organize and visualize the data collected during the survey using the major field of study and gender variables. Survey 2 The table below gives the rating of the performance and salary for the employees of a company through last year. Employee ID Performance Salary in Jout 100 A 70 1000 B 80 1200 IC 195 1400 D 198 1200 53 1600 F 78 1000 IG 35 500 H 23 350 190 1500 80 1400 K 185 1350 IL 70 1200 M 165 1200 N 60 500 o 63 1650 Instructions: 1) Organize and visualize the data collected during the survey using the employee's performance variable. 2) Organize and visualize the data collected during the survey using the employee's salary and performance variables
Step by Step Solution
There are 3 Steps involved in it
1 Expert Approved Answer
Step: 1 Unlock

Question Has Been Solved by an Expert!
Get step-by-step solutions from verified subject matter experts
Step: 2 Unlock
Step: 3 Unlock