

Question: 3) Justify your chosen communicating method for each given variable. 4) Critically evaluate the use of different types of charts/tables by making an effective judgment

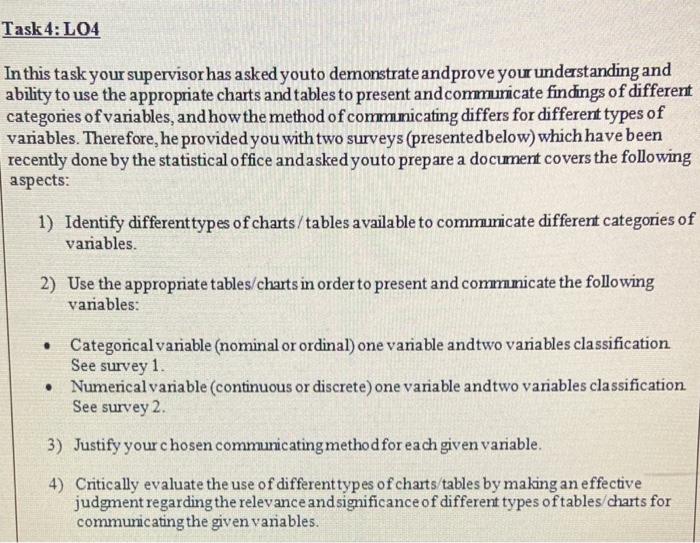
3) Justify your chosen communicating method for each given variable. 4) Critically evaluate the use of different types of charts/tables by making an effective judgment regarding the relevance and significance of different types of tables/charts for communicating the given variables. Task 4: L04 In this task your supervisor has asked youto demonstrate andprove you understanding and ability to use the appropriate charts and tables to present and commuricate findings of different categories of variables, and how the method of commnicating differs for different types of variables. Therefore, he provided you with two surveys (presentedbelow)which have been recently done by the statistical office andasked youto prepare a document covers the following aspects: 1) Identify different types of charts/tables available to communicate different categories of variables. 2) Use the appropriate tables/charts in order to present and communicate the following variables: Categorical variable (nominal or ordinal)one variable andtwo variables classification See survey 1. Numerical variable (continuous or discrete) one variable andtwo variables classification See survey 2. 3) Justify your chosen communicating method for each given variable. 4) Critically evaluate the use of different types of charts/tables by making an effective judgment regarding the relevance andsignificance of different types of tables/charts for communicating the given variables. 3) Justify your chosen communicating method for each given variable. 4) Critically evaluate the use of different types of charts/tables by making an effective judgment regarding the relevance and significance of different types of tables/charts for communicating the given variables. Task 4: L04 In this task your supervisor has asked youto demonstrate andprove you understanding and ability to use the appropriate charts and tables to present and commuricate findings of different categories of variables, and how the method of commnicating differs for different types of variables. Therefore, he provided you with two surveys (presentedbelow)which have been recently done by the statistical office andasked youto prepare a document covers the following aspects: 1) Identify different types of charts/tables available to communicate different categories of variables. 2) Use the appropriate tables/charts in order to present and communicate the following variables: Categorical variable (nominal or ordinal)one variable andtwo variables classification See survey 1. Numerical variable (continuous or discrete) one variable andtwo variables classification See survey 2. 3) Justify your chosen communicating method for each given variable. 4) Critically evaluate the use of different types of charts/tables by making an effective judgment regarding the relevance andsignificance of different types of tables/charts for communicating the given variables
Step by Step Solution
There are 3 Steps involved in it

Get step-by-step solutions from verified subject matter experts