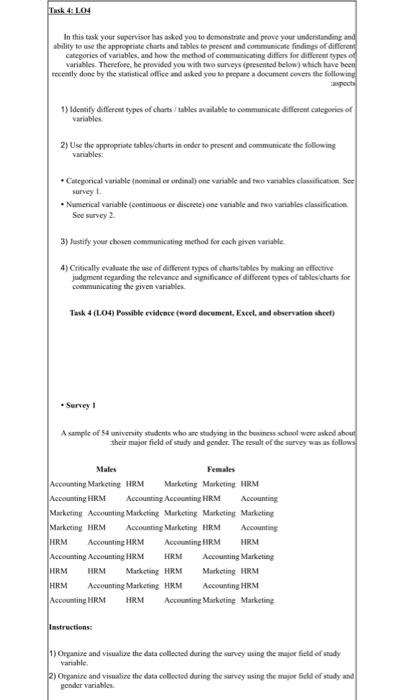
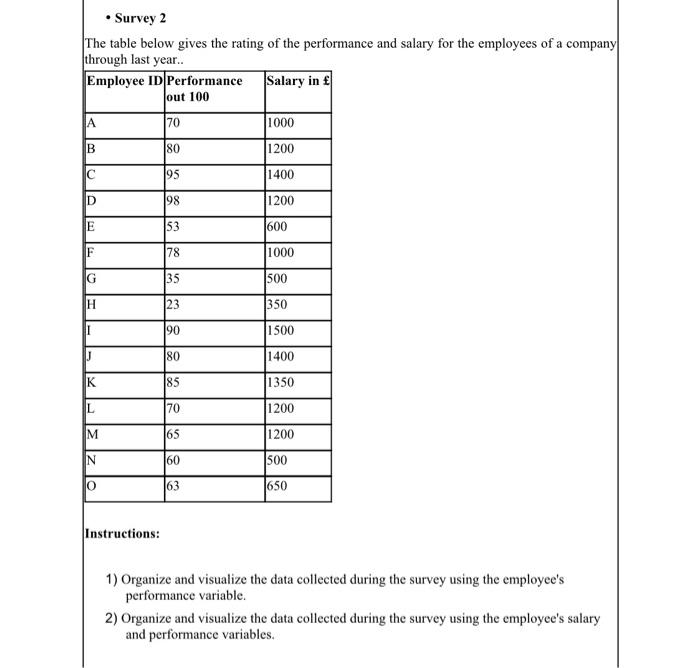
Question: Task 4: L04 In this task your supervisor has asked you to demonstrate and prove your understanding and ability to use the appropriate charts and

Task 4: L04 In this task your supervisor has
Task 4: L04 In this task your supervisor has asked you to demonstrate and prove your understanding and ability to use the appropriate charts and tables to present and communicate findings of different Categories of variables, and how the method of communicating differs for different types of variables. Therefore he provided you with two surveys (presented below) which have been recently done by the statistical office and asked you to prepare a document comes the following 1) Identity different types of charts/ tables available to communicate different categories of variables 2) Use the appropriate tahles charts in order to present and communicate the following variables: Categorical variable (tominal er ordinulote variable and two variables classification. See survey Numerical variable continuous or discrete) one variable and two variables classification See survey 2 3) Justify your chosen communicating method for each given variable. 4) Critically evaluate the use of different types of chans tables by making an effective judgment regarding the relevance and significance of different types of tables chants for communicating the given variables Task 4 (104) Possible evidence (word document, Excel, and observation sheet) Survey A sample of a univenity students who are studying in the business school were asked abou their major field of study and gender. The result of the survey was as follows Males Females Accounting Marketing HRM Marketing Marketing HRM Accounting HRM Accounting Accounting HRM Accounting Marketing Accounting Marketing Marketing Marketing Marketing Marketing HRM Accounting Marketing HRM Accounting HRM Accounting HRM Accounting HIRM HRM Accounting Accounting HRM HRM Accounting Marketing HRM HRM Marketing HRM Marketing HRM HRM Accounting Marketing HRM Accounting HRM Accounting HRM HRM Accounting Marketing Marketing Instructions: 1) Organize and visualize the data collected during the survey using the maje field of study Variable 2) Organize and visualize the data collected during the survey using the major field of study and onder variables Survey 2 The table below gives the rating of the performance and salary for the employees of a company through last year.. Employee ID Performance Salary in out 100 70 1000 A B 80 1200 95 1400 D 98 1200 E 53 1600 F 78 1000 G 35 500 350 H 23 1500 1400 K 1350 Elles 18 L 1200 M 1200 N 500 o 63 650 Instructions: 1) Organize and visualize the data collected during the survey using the employee's performance variable. 2) Organize and visualize the data collected during the survey using the employee's salary and performance variables. Task 4: L04 In this task your supervisor has asked you to demonstrate and prove your understanding and ability to use the appropriate charts and tables to present and communicate findings of different Categories of variables, and how the method of communicating differs for different types of variables. Therefore he provided you with two surveys (presented below) which have been recently done by the statistical office and asked you to prepare a document comes the following 1) Identity different types of charts/ tables available to communicate different categories of variables 2) Use the appropriate tahles charts in order to present and communicate the following variables: Categorical variable (tominal er ordinulote variable and two variables classification. See survey Numerical variable continuous or discrete) one variable and two variables classification See survey 2 3) Justify your chosen communicating method for each given variable. 4) Critically evaluate the use of different types of chans tables by making an effective judgment regarding the relevance and significance of different types of tables chants for communicating the given variables Task 4 (104) Possible evidence (word document, Excel, and observation sheet) Survey A sample of a univenity students who are studying in the business school were asked abou their major field of study and gender. The result of the survey was as follows Males Females Accounting Marketing HRM Marketing Marketing HRM Accounting HRM Accounting Accounting HRM Accounting Marketing Accounting Marketing Marketing Marketing Marketing Marketing HRM Accounting Marketing HRM Accounting HRM Accounting HRM Accounting HIRM HRM Accounting Accounting HRM HRM Accounting Marketing HRM HRM Marketing HRM Marketing HRM HRM Accounting Marketing HRM Accounting HRM Accounting HRM HRM Accounting Marketing Marketing Instructions: 1) Organize and visualize the data collected during the survey using the maje field of study Variable 2) Organize and visualize the data collected during the survey using the major field of study and onder variables Survey 2 The table below gives the rating of the performance and salary for the employees of a company through last year.. Employee ID Performance Salary in out 100 70 1000 A B 80 1200 95 1400 D 98 1200 E 53 1600 F 78 1000 G 35 500 350 H 23 1500 1400 K 1350 Elles 18 L 1200 M 1200 N 500 o 63 650 Instructions: 1) Organize and visualize the data collected during the survey using the employee's performance variable. 2) Organize and visualize the data collected during the survey using the employee's salary and performance variables

Step by Step Solution

There are 3 Steps involved in it

1 Expert Approved Answer
Step: 1 Unlock blur-text-image
Question Has Been Solved by an Expert!

Get step-by-step solutions from verified subject matter experts

Step: 2 Unlock
Step: 3 Unlock

Students Have Also Explored These Related General Management Questions!