

Question: In this task your supervisor has asked you to demonstrate and prove your understanding and ability to use the appropriate charts and tables to present
In this task your supervisor has asked you to demonstrate and prove your understanding and ability to use the appropriate charts and tables to present and communicate findings of different categories of variables, and how the method of communicating differs for different types of variables. Therefore, he provided you with two surveys (presented below) which have been recently done by the statistical office and asked you to prepare a document covers the following aspects:
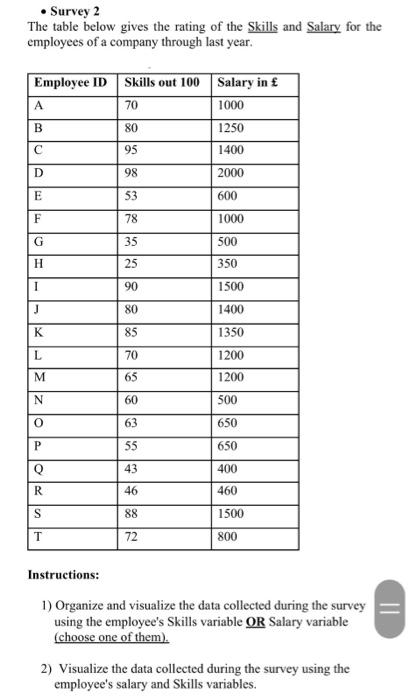
Survey 2 The table below gives the rating of the Skills and Salary for the employees of a company through last year. Employee ID Skills out 100 Salary in A 70 1000 B 80 1250 C 1400 D 2000 E 600 F 1000 G 500 H 350 I 1500 J 1400 K 1350 L 1200 1200 M N 500 0 650 P 650 Q 400 R 460 S 1500 T 800 Instructions: 1) Organize and visualize the data collected during the survey using the employee's Skills variable OR Salary variable (choose one of them). 2) Visualize the data collected during the survey using the employee's salary and Skills variables. | | | | | | 35 25 90 80 85 70 65 60355354677 88 72 ||
Step by Step Solution
There are 3 Steps involved in it

Get step-by-step solutions from verified subject matter experts